Adaptive Trend Breaks Adaptive Trend Breaks
## WHAT IT DOES
This script is a modified and enhanced version of "Trendline Breakouts With Targets" concept by ChartPrime.
Adaptive Trend Breaks (ATB) is a trendline breakout system optimized for scalping liquid futures contracts. The indicator automatically draws dynamic support and resistance trendlines based on pivot points, then generates trade signals when price breaks through these levels with confirmation filters. It includes automated target and stop-loss placement with real-time P&L tracking in dollars.
## HOW IT WORKS
**Trendline Detection Method:**
The indicator uses pivot high/low detection to identify significant price turning points. When a new pivot forms, it calculates the slope between consecutive pivots to draw dynamic trendlines. These lines extend forward based on the established trend angle, creating actionable support and resistance zones.
**Band System:**
Around each trendline, the script creates a "band" using a volatility-adjusted calculation: `ATR(14) * 0.2 * bandwidth multiplier / 2`. This adaptive band accounts for current market conditions - wider during volatile periods, tighter during quiet markets.
**Breakout Logic:**
A breakout signal triggers when:
1. Price closes beyond the trendline + band zone
2. Volume exceeds the 20-period moving average by your set multiplier (default 1.2x)
3. Price is within Regular Trading Hours (9:30-16:00 EST) if session filter enabled
4. Current ATR meets minimum volatility threshold (prevents trading dead markets)
**Target & Stop Calculation:**
Upon breakout confirmation:
- **Entry**: Trendline breach point
- **Target**: Entry ± (bandwidth × target multiplier) - default 8x for quick scalps
- **Stop**: Entry ± (bandwidth × stop multiplier) - default 8x for 1:1 risk/reward
- Multipliers adjust automatically to market volatility through the ATR-based band
**P&L Conversion:**
The script converts point movements to dollars using:
```
Dollar P&L = (Price Points × Contract Point Value × Quantity)
```
For example, a 10-point NQ move with 2 contracts = 10 × $20 × 2 = $400
## HOW TO USE IT
**Setup:**
1. Select your instrument (NQ/ES/YM/RTY) - point values auto-configure
2. Set contract quantity for accurate dollar P&L
3. Choose pivot period (lower = more signals but more noise, default 5 for scalping)
4. Adjust bandwidth multiplier if trendlines are too tight/loose (1-5 range)
**Filters Configuration:**
- **Volume Filter**: Requires breakout volume > moving average × multiplier. Increase multiplier (1.5-2.0) for higher conviction trades
- **Session Filter**: Enable to trade only RTH. Disable for 24-hour trading
- **ATR Filter**: Prevents signals during low volatility. Increase minimum % for more active markets only
**Risk Management:**
- Set target/stop multipliers based on your risk tolerance
- 8x bandwidth = approximately 1:1 risk/reward for most liquid futures
- Enable trailing stops for trend-following approach (moves stop to protect profits)
- Adjust line length to see targets further into the future
**Statistics Table:**
- Choose timeframe to analyze: all-time, today, this week, custom days
- Monitor win rate, profit factor, and net P&L in dollars
- Track long vs short performance separately
- See real-time unrealized P&L on active trades
**Reading Signals:**
- **Green triangle below bar** = Long breakout (resistance broken)
- **Red triangle above bar** = Short breakout (support broken)
- **White dashed line** = Entry price
- **Orange line** = Take profit target with dollar value
- **Red line** = Stop loss with dollar value
- **Green checkmark (✓)** = Target hit, winning trade
- **Red X (✗)** = Stop hit, losing trade
## WHAT IT DOES NOT DO
**Limitations to Understand:**
- Does not predict future trendline formations - it reacts to breakouts after they occur
- Historical trendlines disappear after breakout (not kept on chart for clarity)
- Requires sufficient volatility - may not signal in extremely quiet markets
- Volume filter requires exchange volume data (not available on all symbols)
- Statistics are indicator-based simulations, not actual trading results
- Does not account for slippage, commissions, or order fills
## BEST PRACTICES
**Recommended Settings by Market:**
- **NQ (Nasdaq)**: Default settings work well, consider volume multiplier 1.3-1.5
- **ES (S&P 500)**: Slightly slower, try period 7-8, volume 1.2
- **YM (Dow)**: Lower volatility, reduce bandwidth to 1.5-2
- **RTY (Russell)**: Higher volatility, increase bandwidth to 3-4
**Risk Management:**
- Never risk more than 2-3% of account per trade
- Use contract quantity calculator: Max Risk $ ÷ (Stop Distance × Point Value)
- Start with 1 contract while learning the system
- Backtest your specific timeframe and instrument before live trading
**Optimization Tips:**
- Increase pivot period (7-10) for fewer but higher-quality signals
- Raise volume multiplier (1.5-2.0) in choppy markets
- Lower target/stop multipliers (5-6x) for tighter profit taking
- Use trailing stops in strong trending conditions
- Disable session filter for overnight gaps and Asia session moves
## TECHNICAL DETAILS
**Key Calculations:**
- Pivot Detection: `ta.pivothigh(high, period, period/2)` and `ta.pivotlow(low, period, period/2)`
- Slope Calculation: `(newPivot - oldPivot) / (newTime - oldTime)`
- Adaptive Band: `min(ATR(14) * 0.2, close * 0.002) * multiplier / 2`
- Breakout Confirmation: Price crosses trendline + 10% of band threshold
**Data Requirements:**
- Minimum bars in view: 500 for proper pivot calculation
- Volume data required for volume filter accuracy
- Intraday timeframes recommended (1min - 15min) for scalping
- Works on any timeframe but optimized for fast execution
**Performance Metrics:**
All statistics calculate based on indicator signals:
- Tracks every signal as a trade from entry to TP/SL
- P&L in actual contract dollar values
- Win rate = (Winning trades / Total trades) × 100
- Profit factor = Gross profit / Gross loss
- Separates long/short performance for bias analysis
## IDEAL FOR
- Futures scalpers and day traders
- Traders who prefer visual trendline breakouts
- Those wanting automated TP/SL placement
- Traders tracking performance in dollar terms
- Multiple timeframe analysis (compare 1min vs 5min signals)
## NOT SUITABLE FOR
- Swing trading (targets too close)
- Stocks/forex without modifying point values
- Extremely low timeframes (<30 seconds) - too much noise
- Markets without volume data if using volume filter
- Illiquid contracts (signals may not execute at shown prices)
---
**Settings Summary:**
- Core: Period, bandwidth, extension, trendline style
- Filters: Volume, RTH session, ATR volatility
- Risk: R:R ratio, target/stop multipliers, trailing stop
- Display: Stats table position, size, colors
- Stats: Timeframe selection (all-time to custom days)
**License:** This indicator is published open-source under Mozilla Public License 2.0. You may use and modify the code with proper attribution.
**Disclaimer:** This indicator is for educational purposes. Past performance does not guarantee future results. Always practice proper risk management and test thoroughly before live trading.
---
## CREDITS & ATTRIBUTION
This script builds upon the "Trendline Breakouts With Targets" concept by ChartPrime with significant enhancements:
**Major Improvements Added:**
- **Futures-Specific Calculations**: Automated dollar P&L conversion using actual contract point values (NQ=$20, ES=$50, YM=$5, RTY=$50)
- **Advanced Statistics Engine**: Comprehensive performance tracking with customizable timeframe analysis (today, week, month, custom ranges)
- **Multi-Layer Filtering System**: Volume confirmation, RTH session filter, and ATR volatility filter to reduce false signals
- **Professional Trade Management**: Enhanced visual trade tracking with separate TP/SL lines, dollar value labels, and optional trailing stops
- **Optimized for Scalping**: Faster pivot periods (5 vs 10), tighter bands, and reduced extension bars for quick entries
Original trendline detection methodology by ChartPrime - used with modification under Mozilla Public License 2.0.
In den Scripts nach "take profit" suchen

AnchorPulse RWAP Universal ScalperWhat it is
AnchorPulse Scalper is an intraday indicator that reads price in real time through three ideas working together.
A live pivot engine that detects the current micro leg.
An Anchored Range Weighted Average Price that starts at each new leg or session.
An adaptive rhythm score that communicates a simple bias: Buy, Sell, or Wait.
The goal is clarity. You get one anchor line, soft bands that show stretch, discrete Buy and Sell marks, and a plain-language dashboard that says Trend, Phase, Bias, Momentum, Volatility, Stretch, ETA to next turn, and Regime. No external dependencies and no lookahead. It is designed for standard chart types on one to five minute timeframes across liquid symbols such as major FX, index futures, large cap stocks, and mainstream crypto pairs.
What makes it original
Most scalpers either track a fixed moving average or draw from a session VWAP. AnchorPulse does neither. The anchor resets at every new micro leg detected by a real time pivot engine that measures distance in units of ATR rather than in fixed points. This produces a responsive anchor that updates only when the market proves a leg has turned. On top of that, the rhythm timer keeps an average of how long legs usually last, so the indicator can treat the start and the end of a leg differently. Early in a leg it favors continuation signals. Late in a leg it watches for mean reversion. This mix of an ATR-based leg detector, a leg-anchored RWAP, and a rhythm aware bias is the core originality.
Plain explanation of the calculations
Pivot engine. While price travels up, the script tracks the highest high reached since the last pivot. If price pulls back from that extreme by at least a user defined fraction of ATR, the leg flips down. The reverse applies to down legs. The distance threshold is adaptive because ATR changes with volatility. A short cooldown in bars can prevent double flips on violent bars.
Anchored Range Weighted Average Price. From the first bar of each new leg the script accumulates a weighted average of the typical price, where the weight is the true range of each bar. The anchor can also reset at the start of a session and can ignore the very first session bar to avoid overweighting the open gap.
Progress and phase. The script measures how far price traveled from the last pivot relative to the reversal threshold. That is progress. At the same time it maintains an exponential average of leg duration in bars. The current leg age divided by that average is the age ratio. An age ratio below an adaptive early threshold means Early. Above an adaptive late threshold means Late. The thresholds drift with recent variability in leg length so they match the rhythm of the market.
Wick pressure and intrabar skew. Lower wick minus upper wick, normalized by ATR and smoothed, acts as tape pressure. The sign of close minus open, smoothed, is intrabar skew. They are combined into a compact momentum read.
Bands and stretch. The script computes the deviation of typical price from the anchor and builds soft bands around the anchor. Standard deviation is capped by a multiple of mean absolute error to avoid inflated bands just after a pivot.
Regime filter. You may optionally gate continuation entries when the higher timeframe EMA disagrees, or gate reversals when ADX shows strong trend.
Adaptive edge score. Progress and momentum are turned into percentile scores using a normal CDF of their rolling z scores. This yields a familiar zero to one hundred scale that is easier to read than raw values. Early in an up leg adds a small bonus to long bias. Early in a down leg adds a small bonus to short bias.
Gap cap. Signals are rejected if price is too far from the anchor. The cap is expressed as a fraction of price, which scales across symbols.
What you see on the chart
One white anchor line. Two transparent bands. Subtle green or orange background when a bias is active. Buy marks below bars and Sell marks above bars. Small triangles at pivots. Bar tint softly aligned with momentum. A compact table in the corner that tells you the state in plain language. On alert, a single JSON line can be sent to your alert channel with ticker, timeframe, trend, phase, bias, edge score, stretch, ETA in bars, and regime note.
How to use it in practice
Choose a liquid symbol and a one to five minute timeframe.
Keep the mode on Hybrid until you learn the personality of the market. If you notice long directional pushes, try Continuation mode. If you see frequent fades near the end of legs, try Reversal mode.
Read the table. Trend shows Up or Down according to the current leg. Phase shows Early, Mid, or Late from the rhythm timer. Bias shows Buy, Sell, or Wait once the signal rules and the gap cap are satisfied. Momentum reads Strong Up, Neutral, or Strong Down from wick pressure and skew. Volatility shows Calm, Average, or Wild relative to an ATR baseline. Stretch vs anchor prints the distance between close and the anchor as a percent of price. ETA shows how many bars remain to the average leg length if such a read is meaningful. Regime reflects the optional gate: None, HTF Up, HTF Down, Strong, or Soft.
Focus on the anchor. Continuation longs are stronger when price holds above the anchor in the first part of an up leg with positive momentum and adequate progress. Continuation shorts are the mirror case below the anchor. Reversal longs are stronger when a down leg is late, price crosses the anchor, and momentum flips positive. Reversal shorts are the mirror case in late up legs.
Respect the gap cap. When price is stretched far away from the anchor, skip signals and wait for re-alignment or a fresh leg.
Keep the chart clean. The script is designed to work on its own. If you add other tools, make sure they do not paint multiple backgrounds or heavy drawings that obscure the anchor and the bands.
Inputs explained with practical defaults
The script ships with sensible defaults and all inputs provide tooltips inside the indicator. The description here is included so traders who do not read code can still understand how to tune it.
Signal mode. Continuation uses early leg logic. Reversal uses late leg logic at anchor crosses. Hybrid allows both and lets the edge score decide.
ATR length and Pivot reversal in ATR. These govern flips. Shorter ATR and smaller reversal multiples yield faster turns and more signals. Longer and larger do the opposite. A middle ground such as ATR 50 with reversal 0.75 often reads well across liquid markets.
Rhythm smoothing length and Freeze bars after flip. The first sets how quickly the average leg length adapts. The second prevents double flips on wide bars. Values around 20 and 1 to 3 bars work well for most symbols.
Session hours, Session reset, and Skip first session bar. These are optional. Day sessions in equities can benefit from a reset and from skipping the first bar so the anchor is not dragged by the open gap. Round the session to your venue.
Wick pressure length and Intrabar skew length. They control how quickly the micro momentum reacts. Values between 6 and 12 for wick pressure and 4 to 10 for skew are common.
Early and Late thresholds and the Adaptive option. If you turn adaptation on, the thresholds drift with leg variability. The adaptiveness setting controls the strength of that drift.
Minimum progress and Maximum stretch vs anchor. The first ensures that continuation signals only occur once the leg moved a minimum distance from the last pivot. The second prevents chasing far from the anchor. As a rule, raise minimum progress when the market chops and reduce it on trend days. Keep stretch around one to two percent for many symbols, then adjust by product.
Regime filter. Higher timeframe EMA supports trend alignment. ADX supports a simple read on the strength of trend. Use one at a time or none, depending on your preference.
Adaptive scoring lookback. The percentile logic needs a modest window. Values near one hundred twenty bars tend to give stable ranks without lagging too much.
Band settings. Band length and width control the look of the soft channel around the anchor. The cap versus mean absolute error is there to keep the bands realistic just after flips.
Visual controls. Pick labels, triangles, or circles, and choose to mark only state changes if you prefer a very clean chart.
Why the dashboard uses plain language
Many traders prefer to reason in simple terms rather than in raw values. The table abstracts the math into natural categories such as Early versus Late, Calm versus Wild, or Strong Up versus Strong Down. The only numeric reads are Stretch and Edge score because these help in threshold decisions. Stretch is a percent of price so it scales across markets. Edge is a normalized score from zero to one hundred that reflects the combined progress, momentum, and phase. The table is intended to be the only element you need to glance at during a fast session once you learn the anchor and the band cues.
Design choices and integrity
No repaint. The script uses bar closes and standard Pine semantics with lookahead off in security calls. There are no offset tricks that move plotted values after the fact.
One background painter. Background tint is created by a single call to avoid vertical stripes.
Reset logic is explicit. The anchor resets at a pivot or at session start if that option is enabled. This is written to be transparent so you know why the anchor restarted.
Conservative defaults. Out of the box, the script is not tuned to over trade. It communicates bias rather than forcing entries.
Clean chart guidance. The tool is meant to be used on standard bars or candles. It is not intended for synthetic chart types such as Heikin Ashi, Renko, Kagi, Point and Figure, or Range for the purpose of signal generation.
How to read a few common situations
Breakout with strong follow through. Trend reads Up. Phase reads Early. Momentum reads Strong Up. Stretch sits inside the band. Bias shows Buy. This is the typical continuation long.
Extended push into exhaustion. Trend reads Up. Phase reads Late. Momentum cools. Stretch prints a high positive percent of price. Bias flips to Wait, sometimes to Sell after an anchor cross. This is the potential reversal short.
Mean reverting chop. Trend flips often. Phase hangs around Mid. Momentum flips sign frequently. Stretch hovers near zero. Bias often prints Wait. In this case you let the market speak and only act when the leg matures or when stretch spikes away from the anchor.
Trend day with strength. ADX filter reads Strong. Continuation is allowed. Reversal attempts are blocked. Bias favors the dominant direction.
Session open. If you selected a session reset and chose to skip the first bar, the anchor starts at the second bar and the first prints do not dominate the anchor.
Limits and realistic expectations
This indicator measures leg structure and micro pressure to suggest a bias. It is not a self-contained trading system. It does not size positions, pick stops, or set take profits. It does not promise accuracy or profits. In violent markets the pivot detector can flip and then flip back. Cooldown reduces this effect but cannot remove it. During news and illiquid hours the anchor can move very quickly. Wide slippage and spread can make any intraday approach impractical. These are standard realities of intraday trading and they also apply here.
Suggested workflows
Discretionary scalper. Keep the chart clean. Use the table to decide whether to engage, then work entries at the anchor or inside the band. Focus on position risk and a predefined stop level independent of the script.
Session specialist. If you trade a venue with strong sessions such as US equities or major FX sessions, enable the session reset. Many traders find the tool shines in the first two hours and the last hour of an active session.
Multi timeframe monitor. Keep AnchorPulse on one to five minutes and a simple higher timeframe EMA on a separate chart. If you prefer a single chart, switch the regime filter to HTF Trend and let the indicator handle it.
Alert driven workflow. Create alerts on Buy or Sell. The payload contains the essential context so you can log and review. Use the payload fields to build a small notebook of cases you like to take.
Why it is published as protected
The script contains original logic that relies on a compact set of calculations not commonly seen together. Publishing as protected keeps the logic intact while still giving the community full access through the Public Library.
Frequently asked questions
Does it repaint
No. The pivot flips on confirmed bars using ATR distance. The anchor, bands, and dashboard read from that state and do not shift after the bar closes.
What settings should I change first
Try the reversal distance in ATR and the minimum progress. These two govern how active or selective the tool becomes. If you see too many flips, raise the ATR multiple or the freeze bars. If you want faster action, lower them slightly.
What is a reasonable stretch cap
One to two percent of price is a useful starting point for many symbols. Thin products may need a larger cap. Extremely liquid products can often work with a smaller cap.
Should I use the regime filter
On days with persistent trend, the higher timeframe EMA filter or the ADX filter can help keep you with the flow. On rotational days, consider turning the filter off to allow more two sided action.
Can I use it on higher timeframes
The logic works on any timeframe, but the design and defaults target one to five minutes. If you go higher, adjust the ATR length, reversal distance, and rank lookback accordingly.
Can I combine it with volume
Yes. A simple volume filter that marks above average volume near the anchor can help you time entries. Keep the chart readable.
Risk notice and user responsibility
This indicator is a tool for research and education. It does not give investment advice, trade recommendations, or any guarantee of outcomes. All trading carries risk including the loss of capital. Past performance is not a reliable guide to future results. You are solely responsible for your trading decisions, for verifying that the indicator behaves as you expect on your data and platform settings, and for selecting appropriate risk controls such as position sizing, stops, and loss limits.
Summary
AnchorPulse Scalper is a concise way to read the market’s current leg, its anchor, and its rhythm. The pivot engine tells you direction. The leg-anchored RWAP shows where value sits for this micro move. The adaptive score simplifies momentum and progress into a familiar scale. The dashboard translates complex calculations into the plain words that scalpers actually use. If you prefer simple signals, enable alerts and let them flow into your log. If you prefer context, watch the anchor and bands as the leg evolves and let the rhythm guide your timing. Use it respectfully on a clean chart, stay realistic, and keep your own rules for risk.

MNQ TopStep 50K | Ultra Quality v3.0MNQ TopStep 50K | Ultra Quality v3.0 - Publish Summary
📊 Overview
A professional-grade trading indicator designed specifically for MNQ futures traders using TopStep funded accounts. Combines 7 technical confirmations with 5 advanced safety filters to deliver high-quality trade signals while managing drawdown risk.
🎯 Key Features
Core Signal System
7-Point Confirmation: VWAP, EMA crossovers, 15-min HTF trend, MACD, RSI, ADX, and Volume
Signal Grading: Each signal is rated A+ through D based on 7 quality factors
Quality Threshold: Adjustable minimum grade requirement (A+, A, B, C, D)
Advanced Safety Filters (Customizable)
Mean Reversion Filter - Prevents chasing extended moves beyond VWAP bands
ATR Spike Filter - Avoids trading during extreme volatility events
EMA Spacing Filter - Ensures proper trend separation (optional)
Momentum Filter - Requires consecutive directional bars (optional)
Multi-Timeframe Confirmation - Aligns with 15-min trend (optional)
TopStep Risk Management
Real-time drawdown tracking
Position sizing calculator based on remaining cushion
Daily loss limit monitoring
Consecutive loss protection
Max trades per day limiter
Visual Components
VWAP with 1σ, 2σ, 3σ bands
EMA 9/21 with cloud fill
15-min EMA 50 for HTF trend
Comprehensive metrics dashboard
Risk management panel
Filter status panel
Detailed trade labels with entry, stops, and targets
⚙️ Default Settings (Balanced for Regular Signals)
Technical Indicators
Fast EMA: 9 | Slow EMA: 21 | HTF EMA: 50 (15-min)
MACD: 10/22/9
RSI: 14 period | Thresholds: 52 (buy) / 48 (sell)
ADX: 14 period | Minimum: 20
ATR: 14 period | Stop: 2x | TP1: 2x | TP2: 3x
Volume: 1.2x average required
Session Settings
Default: 9:30 AM - 11:30 AM ET (adjustable)
Avoids first 15 minutes after market open
Customizable trading hours
Safety Filters (Default Configuration)
✅ Mean Reversion: Enabled (2.5σ max from VWAP)
✅ ATR Spike: Enabled (2.0x threshold)
❌ EMA Spacing: Disabled (can enable for quality)
❌ Momentum: Disabled (can enable for quality)
❌ MTF Confirmation: Disabled (can enable for quality)
Risk Controls
Minimum Signal Quality: C (adjustable to A+ for fewer/better signals)
Min Bars Between Signals: 10
Max Trades Per Day: 5
Stop After Consecutive Losses: 2
📈 Expected Performance
With Default Settings:
Signals per week: 10-15 trades
Estimated win rate: 55-60%
Risk-Reward: 1:2 (TP1) and 1:3 (TP2)
With Aggressive Settings (Min Quality = D, All Filters Off):
Signals per week: 20-25 trades
Estimated win rate: 50-55%
With Conservative Settings (Min Quality = A, All Filters On):
Signals per week: 3-5 trades
Estimated win rate: 65-70%
🚀 How to Use
Basic Setup:
Add indicator to MNQ 5-minute chart
Adjust TopStep account settings in inputs
Set your risk per trade percentage (default: 0.5%)
Configure trading session hours
Set minimum signal quality (Start with C for balanced results)
Signal Interpretation:
Green Triangle (BUY): Long signal - all confirmations aligned
Red Triangle (SELL): Short signal - all confirmations aligned
Label Details: Shows entry, stop loss, take profit levels, position size, and signal grade
Signal Grade: A+ = Elite (6-7 points) | A = Strong (5) | B = Good (4) | C = Fair (3)
Dashboard Monitoring:
Top Right: Technical metrics and market conditions
Top Left: Filter status (which filters are passing/blocking)
Bottom Right: TopStep risk metrics and position sizing
⚡ Customization Tips
For More Signals:
Lower "Minimum Signal Quality" to D
Decrease ADX threshold to 18-20
Lower RSI thresholds to 50/50
Reduce Volume multiplier to 1.1x
Disable additional filters
For Higher Quality (Fewer Signals):
Raise "Minimum Signal Quality" to A or A+
Increase ADX threshold to 25-30
Enable all 5 advanced filters
Tighten VWAP distance to 2.0σ
Increase momentum requirement to 3-4 bars
For TopStep Compliance:
Adjust "Max Total Drawdown" and "Daily Loss Limit" to match your account
Update "Already Used Drawdown" daily
Monitor the Risk Panel for cushion remaining
Use recommended contract sizing
🛡️ Risk Disclaimer
IMPORTANT: This indicator is for educational and informational purposes only.
Past performance does not guarantee future results
All trading involves substantial risk of loss
Use proper risk management and position sizing
Test thoroughly in paper trading before live use
The indicator does not guarantee profitable trades
Adjust settings based on your risk tolerance and trading style
Always comply with your broker's and TopStep's rules

MNQ TopStep 50K | Ultra Quality v3.0MNQ TopStep 50K | Ultra Quality v3.0 - Publish Summary📊 OverviewA professional-grade trading indicator designed specifically for MNQ futures traders using TopStep funded accounts. Combines 7 technical confirmations with 5 advanced safety filters to deliver high-quality trade signals while managing drawdown risk.🎯 Key FeaturesCore Signal System
7-Point Confirmation: VWAP, EMA crossovers, 15-min HTF trend, MACD, RSI, ADX, and Volume
Signal Grading: Each signal is rated A+ through D based on 7 quality factors
Quality Threshold: Adjustable minimum grade requirement (A+, A, B, C, D)
Advanced Safety Filters (Customizable)
Mean Reversion Filter - Prevents chasing extended moves beyond VWAP bands
ATR Spike Filter - Avoids trading during extreme volatility events
EMA Spacing Filter - Ensures proper trend separation (optional)
Momentum Filter - Requires consecutive directional bars (optional)
Multi-Timeframe Confirmation - Aligns with 15-min trend (optional)
TopStep Risk Management
Real-time drawdown tracking
Position sizing calculator based on remaining cushion
Daily loss limit monitoring
Consecutive loss protection
Max trades per day limiter
Visual Components
VWAP with 1σ, 2σ, 3σ bands
EMA 9/21 with cloud fill
15-min EMA 50 for HTF trend
Comprehensive metrics dashboard
Risk management panel
Filter status panel
Detailed trade labels with entry, stops, and targets
⚙️ Default Settings (Balanced for Regular Signals)Technical Indicators
Fast EMA: 9 | Slow EMA: 21 | HTF EMA: 50 (15-min)
MACD: 10/22/9
RSI: 14 period | Thresholds: 52 (buy) / 48 (sell)
ADX: 14 period | Minimum: 20
ATR: 14 period | Stop: 2x | TP1: 2x | TP2: 3x
Volume: 1.2x average required
Session Settings
Default: 9:30 AM - 11:30 AM ET (adjustable)
Avoids first 15 minutes after market open
Customizable trading hours
Safety Filters (Default Configuration)
✅ Mean Reversion: Enabled (2.5σ max from VWAP)
✅ ATR Spike: Enabled (2.0x threshold)
❌ EMA Spacing: Disabled (can enable for quality)
❌ Momentum: Disabled (can enable for quality)
❌ MTF Confirmation: Disabled (can enable for quality)
Risk Controls
Minimum Signal Quality: C (adjustable to A+ for fewer/better signals)
Min Bars Between Signals: 10
Max Trades Per Day: 5
Stop After Consecutive Losses: 2
📈 Expected PerformanceWith Default Settings:
Signals per week: 10-15 trades
Estimated win rate: 55-60%
Risk-Reward: 1:2 (TP1) and 1:3 (TP2)
With Aggressive Settings (Min Quality = D, All Filters Off):
Signals per week: 20-25 trades
Estimated win rate: 50-55%
With Conservative Settings (Min Quality = A, All Filters On):
Signals per week: 3-5 trades
Estimated win rate: 65-70%
🚀 How to UseBasic Setup:
Add indicator to MNQ 5-minute chart
Adjust TopStep account settings in inputs
Set your risk per trade percentage (default: 0.5%)
Configure trading session hours
Set minimum signal quality (Start with C for balanced results)
Signal Interpretation:
Green Triangle (BUY): Long signal - all confirmations aligned
Red Triangle (SELL): Short signal - all confirmations aligned
Label Details: Shows entry, stop loss, take profit levels, position size, and signal grade
Signal Grade: A+ = Elite (6-7 points) | A = Strong (5) | B = Good (4) | C = Fair (3)
Dashboard Monitoring:
Top Right: Technical metrics and market conditions
Top Left: Filter status (which filters are passing/blocking)
Bottom Right: TopStep risk metrics and position sizing
⚡ Customization TipsFor More Signals:
Lower "Minimum Signal Quality" to D
Decrease ADX threshold to 18-20
Lower RSI thresholds to 50/50
Reduce Volume multiplier to 1.1x
Disable additional filters
For Higher Quality (Fewer Signals):
Raise "Minimum Signal Quality" to A or A+
Increase ADX threshold to 25-30
Enable all 5 advanced filters
Tighten VWAP distance to 2.0σ
Increase momentum requirement to 3-4 bars
For TopStep Compliance:
Adjust "Max Total Drawdown" and "Daily Loss Limit" to match your account
Update "Already Used Drawdown" daily
Monitor the Risk Panel for cushion remaining
Use recommended contract sizing
🛡️ Risk DisclaimerIMPORTANT: This indicator is for educational and informational purposes only.
Past performance does not guarantee future results
All trading involves substantial risk of loss
Use proper risk management and position sizing
Test thoroughly in paper trading before live use
The indicator does not guarantee profitable trades
Adjust settings based on your risk tolerance and trading style
Always comply with your broker's and TopStep's rules

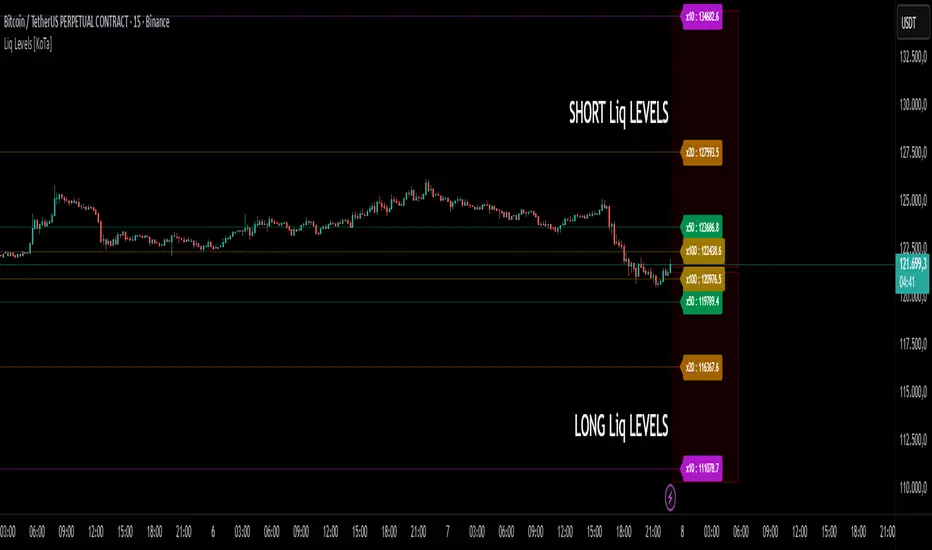
Liq Levels [KoTa]Liq Levels User Guide
Overview
Liquidation Levels visualizes precomputed long & short liquidation price levels relative to the current market price.
For each enabled leverage level (5×, 10×, 20× …), it draws two horizontal lines and small labels:
Short liquidation line (above price) = price × short_multiplier
Long liquidation line (below price) = price × long_multiplier
You can choose which leverage levels to display, control label formatting, choose whether to use the previous bar’s close (no-repaint), change line style & extension, and toggle label size.
Inputs / Settings (what they do)
Use Previous Close (No Repaint) (useConfirmed)
true: the indicator uses close (previous bar close) as reference. Prevents intrabar repainting — recommended for backtesting and stable signals.
false: uses close (current price) — updates intrabar and will repaint during the bar.
Show Price in Label (showValues)
true shows the numeric price next to the x label (e.g., 5x : 42,952.78), false shows only 5x.
Line Style (styleType) — "dot", "line", "dashed".
Extend Lines (extendType) — "none", "left", "right", "both".
Label Size (labelSize) — "normal", "small", "tiny".
Show 5x / 10x / 20x ... 200x (show_5x, etc.) — which multipliers are drawn.
Other technical details in code:
barOffset = 4: label & short segment are placed 4 bars to the right of current bar (so label appears to the right of the bar).
Numbers are formatted according to syminfo.mintick so labels display the appropriate decimal precision.
The script cleans up previously drawn lines & labels on every bar (deletes old objects, draws fresh ones) — so the chart does not accumulate stale objects.
What the lines represent (interpretation)
Each multiplier is precomputed and represents a liquidation price factor used to estimate where positions would be forcibly closed for a given leverage (based on some margin model).
Short multipliers > 1 → short liquidation prices sit above the reference price.
Long multipliers < 1 → long liquidation prices sit below the reference price.
Important: These multipliers are instrument- and margin-model-dependent. The indicator uses the hard-coded multipliers present in the script. Validate these against your exchange / contract type before relying on them for live position sizing.
Why use this indicator?
Use cases:
Risk awareness — see where concentrated liquidation levels sit relative to price; helps avoid taking positions dangerously close to likely liquidation clusters.
Liquidity / cascade detection — when price approaches a large cluster of liquidation levels, sharp moves and cascades can occur; indicator highlights such zones.
Order placement & risk management — place stops or reduce leverage when price nears your liquidation zone.
Trade context — helps decide whether to scale into or out of a trade if the current price is close to many leverage-level liquidation points.
Quick start — how to use (step-by-step)
Load the indicator on the chart.
Choose Use Previous Close = true if you want non-repainting historical levels; false if you prefer intrabar updating. (Recommended: true for backtesting and strategy creation.)
Enable the leverage levels you care about (e.g., 5×, 10×). Keep the number of enabled levels modest (3–4) to avoid clutter.
Choose line style & extension. If you want persistent lines visible across the chart, use extend = left or both. If you only want ephemeral current-level markers, use none.
Interpretation:
If price is approaching the long liquidation line (below price), it’s a sign long positions could be liquidated if price drops further. Consider tightening stops or reducing leverage for long exposure.
If price is approaching the short liquidation line (above price), short positions risk forced closure; similar risk management applies for shorts.
Example strategy (practical, step-by-step)
This is a risk-aware trend-following example that uses the indicator to avoid entering trades too close to liquidation clusters.
Rules
Timeframe: 15-minute or higher for clarity.
Confirm trend with a 50 EMA:
trendUp = price > EMA50
trendDown = price < EMA50
Entry (Long):
trendUp is true.
Price breaks above a short-term resistance or candle close above EMA20 (confirmation).
Distance requirement: current price must be at least X% (example 3%) above the nearest long liquidation line (i.e., price / nearest_long_liquidation >= 1.03).
Enter with defined stop loss: set SL below the nearest long liquidation line OR at a separate level (whichever is more conservative).
Position sizing: choose leverage & size so distance to liquidation gives you at least Y% equity buffer (e.g., 3–5%).
Exit / Take Profit: use risk/reward rule (e.g., 1:2 R:R), or trail stop using EMA or ATR.
Concrete numeric example (worked):
Suppose Use Previous Close = true and the indicator calculates 5× long liquidation at 95.618967 and 5× short at 110.668360 (example base price = 100).
Computation (for clarity):
5× short: 1.10668360333397 × 100 = 110.668360333397 → label shows ~110.668360
20× long: 0.956189674354271 × 100 = 95.61896743542711 → ~95.618967
Entry rule: if price crosses above EMA20 and price / nearest_long_liquidation >= 1.03 (i.e., price ≥ 95.618967 × 1.03 = 98.487536), then entry allowed. If price = 101, condition satisfied (101 / 95.618967 ≈ 1.056).
Why this helps: only enter when you have a buffer above your potential liquidation line; avoid entering directly on top of people’s liquidation levels.
Advantages
Immediate visual risk map — quickly see where liquidations are concentrated (both long & short).
Configurable & non-repainting option — Use Previous Close reduces intrabar repainting for robust backtesting.
Compact & readable — tiny labels and optional price display minimize chart clutter.
Performance-friendly — script deletes and recreates objects each bar, keeping object counts stable and within limits.
Precision formatting via syminfo.mintick so label decimals match the instrument.
Disadvantages & risks / limitations
Multipliers are fixed in the script — they may not reflect the exact margin/liquidation formula of every exchange / contract. Verify with exchange docs before relying on them for trade sizing.
Repainting risk if Use Previous Close = false (intrabar updates). For backtests and alerts you should set it true.
Not a predictor — liquidation levels are potential pressure zones, not guarantees of price movement. Many other market factors affect price action.
Instrument-specific differences — inverse perpetuals, cross margin vs isolated margin, funding rates and insurance funds may change actual liquidation mechanics — the multipliers may be inaccurate for those.
Chart object limits — TradingView has object limits. Although your script deletes and recreates objects each bar and uses max_* _count, using too many levels + large extend combinations on very low timeframes could impact platform performance.
No automatic per-position calculation — the indicator shows levels relative to current price, not your entry; if you need per-trade liquidation price, you must compute using your entry price and actual margin/leverage settings.
Visualizes common long/short liquidation price levels for several leverage multiples. Use the “Use Previous Close” option for stable, non-repainting levels. Verify multipliers vs your exchange before trading.
Long description to paste (publish page content): include the “Why use”, “How to use”, and “Strategy example” sections above plus a short disclaimer (see below).
Include a safety/legal disclaimer in the description:
This indicator is educational and does not constitute financial advice. Multipliers are precomputed and may not precisely match the liquidation mechanics of every exchange or contract. Backtest and verify on your instruments before trading live.
Final notes & suggestions for improvement
If you want tighter integration with your position data (entry price, leverage, margin type), I can add per-trade liquidation calculation inputs (entry price, leverage, maintenance margin) and draw that liquidation line relative to the instrument.
Alt buy signal 1H Entry + 4H Confirm (MACD + Stoch RSI + HMA)This indicator is a multi-timeframe (MTF) analysis tool designed for the ALT trading , capturing entry signals on the 1-hour (1H) timeframe and confirming trends on the 4-hour (4H) timeframe. It combines MACD, Stoch RSI, and Hull Moving Average (HMA) to identify precise buy opportunities, particularly at reversal points after a downtrend or during trend shifts. It visually marks both past and current BUY signals for easy reference.
Key Features:
1H Entry Signal (Early Ping): Triggers on a MACD golden cross (below 0) combined with a Stoch RSI oversold cross (below 20), offering an initial buy opportunity.
4H Trend Confirmation (Entry Ready): Validates the trend with a 4H MACD histogram rising (in negative territory) or a golden cross, plus a Stoch RSI turn-up (above 30).
Past BUY Display: Labels past data points where these conditions were met as "1H BUY" or "FULL BUY," facilitating backtesting.
HMA Filter: Optional HMA(16) to confirm price breakouts, enhancing trend validation.
Purpose: Ideal for short-term scalping and swing trading. Supports a two-step strategy: initial partial entry on 1H signals, followed by additional entry on 4H confirmation.
Usage Instructions
Installation: Add the indicator to an IMX/USDT 1H chart on TradingView.
Signal Interpretation:
lime "1H BUY": 1H conditions met, consider initial entry (stop-loss: 3-5% below recent low).
green "FULL BUY": 1H+4H conditions met, confirm trend for additional entry (take-profit: 10% below recent swing high).
Customization: Adjust TF (1H/4H), MACD/Stoch RSI parameters, and HMA usage via the input settings.
Alert Setup: Enable alerts for "ENTRY READY" (1H+4H) or "EARLY PING" (1H only) conditions.
Advantages
Accuracy: Reduces false signals by combining MACD golden cross below 0 with Stoch RSI oversold conditions.
Dual Confirmation: 1H for quick timing and 4H for trend validation, improving risk management.
Visualization: Past BUY points enable easy backtesting and pattern recognition.
Flexibility: 4H confirmation mode adjustable (histogram rise or golden cross).
Limitations
Timeframe Dependency: Optimized for 1H charts; may not work on other timeframes.
Market Conditions: Potential whipsaws in sideways markets; additional filters (e.g., RSI > 50) recommended.
Manual Management: Stop-loss and take-profit require user discretion.

LP ChecklistLP Checklist — Rejection (ATR + calculator), D1-Fixed, Risk Position Sizing
This script is an on-chart checklist for rejection (bounce) trades based on Gerchik-style level logic, with a fixed daily ATR core and a simple risk calculator. ATR values are latched on D1, so SL/TP remain stable when you switch timeframes. The UI (inputs and panel) is in Russian.
What it does:
• Checklist: three groups (Prerequisites, Negatives, Waiting). You tick items; the panel shows a clean grouped list with counters.
• Rejection calculations: Entry, Stop-Loss, Take-Profit from your level price, k × ATR stop, and a preset RR ratio. A built-in entry offset ≈ 12.5% of the stop distance is applied automatically.
• Entry placement for rejection: after a false break and return back into the range, Long enters above the level (stop below), Short enters below the level (stop above). The built-in entry offset is applied relative to the level and stop side.
• ATR engine (D1): Classic ATR (selectable period; HL or True Range) — always computed and displayed as reference and daily progress. Classic ATR also drives a visible D1-progress metric (current D1 range as a percentage of ATR).
• Active ATR = either 5-day median ATR with optional paranormal bar filter (filters both oversized and undersized D1 ranges by percentage thresholds vs a blended reference) or Manual ATR if enabled.
• Risk calculator: given Deposit and Risk %, the script outputs the entry notional (USD) so an SL hit is approximately equal to your dollar risk; the panel also shows potential PnL to take-profit.
• Stable visuals: level, entry, SL, and TP lines with automatic cleanup on a new day; the panel can be placed in any corner (RU labels).
How to use:
Set Direction (Long/Short) and the Level Price.
Tick checklist items as the setup forms.
In ATR, leave Classic as reference (period + HL/TR), and choose the Active ATR mode: 5-day median (with optional paranormal filter) or Manual (manual value overrides).
Pick k for Stop = k × ATR; TP is placed by the RR preset relative to stop size.
In Calculator, set Deposit and Risk % — the panel returns the entry notional aligned with your risk.
Show or hide panel sections (calculations, ATR, calculator) as needed.
Quick notes:
• Classic ATR is always calculated and shown for context and D1 progress.
• Active ATR drives stop sizing: 5-day median (with filter) or Manual.
• Manual ATR, if enabled, fully replaces the active one in calculations.
• All ATR computations use closed D1 bars; values are cached per day.
• The built-in entry offset equals 12.5% of stop distance and applies automatically to both directions.
Описание (RU)
Чек-лист уровней (Отбой / ЛП) — ATR (классический показывается, активный = медианный 5-дневный или ручной), фиксация D1, расчёт позиции от риска
Скрипт для работы с отбойными (ложно-пробойными) сетапами по логике уровней Герчика: чек-лист на графике, фиксированный дневной ATR, расчёт ТВХ/SL/TP и простой калькулятор позиции от риска. Значения ATR фиксируются на D1, поэтому SL/TP не плавают при смене таймфреймов. Интерфейс (входы и панель) на русском.
Что делает:
• Чек-лист: три группы (Предпосылки, Минусы, Ожидаю). Отмечаете галочки — панель выводит список и счётчики.
• Расчёты отбоя: ТВХ, Стоп-лосс, Тейк-профит от цены уровня; стоп как k × ATR; тейк задаётся пресетом RR; встроен люфт входа ≈ 12.5% от дистанции стопа.
• Правило входа для отбоя: после ложного прокола и возврата внутрь диапазона вход по Long — выше уровня (стоп ниже), по Short — ниже уровня (стоп выше). Люфт входа прикладывается относительно уровня и стороны стопа.
• ATR (D1): Классический ATR (период, HL или True Range) всегда считается и показывается как справочное значение и для прогресса дня. Также отображается процент текущего D1-хода к ATR.
• Активный ATR = медианный за 5 дней с опциональным фильтром паранормальных баров (отсеивает одновременно слишком большие и слишком маленькие дневные диапазоны относительно «смешанного» референса, который равен среднему между mean и median последних D1-диапазонов) или Ручной ATR, если включён.
• Калькулятор риска: по Депозиту и Риску % отдаёт сумму входа (USD) так, чтобы убыток по стопу был близок к заданному риску; дополнительно показывает потенциальный PnL по тейку.
• Стабильная отрисовка: линии Уровень, ТВХ, SL и TP, автоочистка на новый день; позиция панели выбирается (русские подписи углов).
Как работать:
Задайте Направление (Long/Short) и Цену уровня.
Отметьте пункты чек-листа по текущей ситуации.
В ATR используйте Классический как справочный (период + HL/TR), а Активный выберите как медианный 5-дневный (с фильтром при необходимости) или Ручной (ручное значение замещает активный).
Укажите k для Стоп = k × ATR; тейк задаётся пресетом RR относительно размера стопа.
В Калькуляторе задайте Депозит и Риск % — получите сумму входа, согласованную с риском.
В панели можно скрывать или показывать секции (расчёты, ATR, калькулятор).
Важные примечания:
• Классический ATR всегда считается и отображается для контекста и прогресса по дню.
• Активный ATR используется для расчёта стопа: медианный 5D (с фильтром) или ручной.
• Если включён Ручной ATR, он полностью замещает активный ATR в расчётах стопа и RR.
• Все расчёты ATR делаются по закрытым барам D1; значения фиксируются на день.
• Встроенный люфт входа составляет 12.5% от дистанции стопа и применяется автоматически в обе стороны.

BB_MES Playbook Levels + Auto Alerts (Start/TP1/TP2)Indicator Name: MES Playbook Levels + Auto Alerts (Start/TP1/TP2)
1. Indicator Overview
This is a comprehensive technical analysis tool designed for day traders, specifically for Micro E-mini S&P 500 futures (MES) but applicable to other instruments. Its primary purpose is to automate the drawing of key price levels and to provide timely alerts for a specific trading strategy, often called a "playbook" setup.
The core of the strategy involves identifying a "start" level during the regular trading session. Once the price crosses this level, the indicator automatically projects two take-profit (TP1 and TP2) targets and monitors the price action in relation to these levels.
2. Key Features
Automatic Level Plotting: The indicator plots several critical price levels on the chart, saving the trader from having to draw them manually every day.
Dynamic Start Levels: It offers two methods for establishing the bullish and bearish entry or "start" levels:
Previous Day's High/Low (PDH/PDL): The default setting uses the high and low of the prior trading day as the trigger points for long and short trades.
RTH VWAP Bands: Alternatively, it can calculate the Volume-Weighted Average Price (VWAP) that resets at the start of the Regular Trading Hours (RTH) session and create a "band" around it. The edges of this band then serve as the start levels.
Automated Take-Profit Targets: Upon a cross of a "start" level, the indicator immediately plots two take-profit lines (TP1 and TP2) based on a user-defined point value.
Trade State Management: The script intelligently manages the state of a trade. It knows when a long or short trade is active and will stop looking for new signals until the current trade is concluded (either by hitting TP2 or the end of the session).
Comprehensive Alerts: A major feature is its robust alert system. Traders can set up alerts for a wide variety of events, allowing for less screen time.
Session Highlighting: It specifically monitors the Regular Trading Hours (RTH) session and can also plot the high and low of the overnight (ON) session.
3. On-Chart Visuals
When you apply this indicator to your chart, you will see the following lines and plots:
Previous Day Levels:
PDH (Previous Day High): Plotted as a green line.
PDL (Previous Day Low): Plotted as a red line.
PDC (Previous Day Close): Plotted as a gray line.
Start Levels:
StartBull: A lime green line representing the trigger for a long trade.
StartBear: A maroon line representing the trigger for a short trade.
Take-Profit Levels:
TP1 / TP2: Teal-colored lines that appear only after a StartBull or StartBear level is crossed. TP1 is a dotted line, and TP2 is solid.
Other Levels:
RTH VWAP: A blue line showing the volume-weighted average price for the main session only.
ON High / ON Low: Orange lines showing the high and low points established outside of the RTH session.
4. How It Works: The Trading Logic
Define Session: The script first identifies the Regular Trading Hours (e.g., 9:30 AM to 4:00 PM EST).
Calculate Levels: It calculates the PDH/PDL and the RTH VWAP. Based on user input, it determines the startBullLevel (either PDH or the upper VWAP band) and the startBearLevel (either PDL or the lower VWAP band).
Wait for Signal: During the RTH session, the indicator waits for the live price (close) to cross over the startBullLevel or cross under the startBearLevel.
Initiate Trade State:
If a bullish cross occurs (longStart), it logs the entryPrice, sets the trade state to longActive, and plots the TP1 and TP2 lines above the entry price.
If a bearish cross occurs (shortStart), it does the opposite, plotting TP1 and TP2 below the entry price.
Monitor Trade: While a trade is active, it checks if the price hits TP1 or TP2.
End Trade:
When the price hits the TP2 level, the trade is considered complete. The script clears the TP lines from the chart and resets itself to look for the next start signal.
At the end of the RTH session, any active trade is automatically terminated, and all TP lines are cleared to ensure a clean slate for the next day.
5. Input Settings (Customization)
The user can customize the following parameters in the indicator's settings:
RTH Session: Define the start and end times for the main trading session.
Start from RTH VWAP band: A checkbox to switch between using PDH/PDL or the VWAP band for start levels.
VWAP band offset (pts): If using the VWAP band, this sets how many points away from the VWAP the start levels are drawn.
TP1 (pts): The number of points from the entry price to set the first take-profit target.
TP2 (pts): The number of points for the second take-profit target.
Show Overnight High/Low: A toggle to show or hide the overnight session levels.
6. Configurable Alerts
You can create alerts in TradingView for any of the following conditions generated by the script:
StartBull / StartBear: Triggers when a long or short trade is initiated.
TP1 Hit / TP2 Hit: Triggers when the price reaches the take-profit levels for both long and short trades.
Level Crosses: Separate alerts can be set for when the price crosses the PDH, PDL, PDC, RTH VWAP, ON High, or ON Low. This is useful for general market awareness.

DTM 444 BANDS 🚀DTM 444 BANDS 🚀:
The DTM 444 BANDS 🚀 is a powerful, multi-purpose trading indicator combining Supertrend, Dynamic Band Levels, Breakout Signals, and Volume Confirmation to help traders identify high-probability trade setups across different timeframes.
🔧 Key Features
✅ Multi-Timeframe Support
Analyze price action across any timeframe using the Timeframe input.
All band calculations (High, Low, Midline, and Supertrend) are pulled from a higher timeframe for clearer context.
✅ Dynamic Bands Based on Supertrend
High Band: Rolling highest of Supertrend over hiLen period.
Low Band: Rolling lowest of Supertrend over loLen period.
Midline: Midpoint of the above.
Acts like dynamic support/resistance, ideal for trend-following and breakout strategies.
✅ Dual Signal System
Breakout Signals (Buy and Sell): Triggered when price breaks the bands with volume confirmation.
Supertrend Crossover Signals (Buy1 and Sell1): Classic momentum entries with a confirmation twist.
Exit Signals: Optional take-profit/neutral indicators when price reverses.
✅ Volume Confirmation Filter (Optional)
Only triggers signals if the volume exceeds its 20-period SMA.
Helps filter out false breakouts and weak trends in low-liquidity periods.
✅ Visual Enhancements
Color-coded candles based on band positioning (e.g., red = weak, green = strong, etc.)
On-chart labels for each signal for quick reference.
Real-time Signal Dashboard using Pine Script tables showing:
Current signal
Volume filter status
Live volume vs volume SMA
🧪 Practical Use Cases
Trend Traders: Use the Supertrend cross and band breakouts to ride trends early.
Breakout Traders: Catch high-probability moves outside established ranges.
Swing Traders: Time entries and exits using color-coded bars and exit labels.
Volume-Sensitive Traders: Focus on trades with strong volume backing.
📊 Backtest Snapshot
Based on the example chart for Reliance Industries (RELIANCE.NS) on the weekly timeframe:
Several profitable buy and breakout signals during uptrends.
Timely exits and breakdown alerts before reversals.
Volume filter keeps trades clean and avoids noise.
⚙️ Customizable Parameters
High Length and Low Length (default: 19)
Supertrend Multiplier and ATR Length
Volume Filter: Toggle ON/OFF
Volume SMA Length: Default 20
Custom Timeframe: Choose any higher timeframe for multi-timeframe analysis
📢 Alerts Ready
Fully integrated with TradingView alerts:
Breakout & Breakdown
Supertrend crossovers
All alerts respect the volume filter setting
🏁 Final Thoughts
DTM 444 BANDS 🚀 is a versatile and adaptive trading system that blends trend analysis, volatility bands, and volume validation. Whether you're a trend trader, breakout hunter, or swing trader — this tool gives you a structured edge with clear visual cues and real-time alerts.

Trendoman Indicator Trendoman "Trading Signals" indicator
This is our first indicator that will give signals for buying and selling (With the possibility of setting (Alert). The indicator is optimized for the senior TF (1D and 4h). Signals are given automatically after the closing of the candle.
This indicator combines oscillators (Stochastic, RSI, MACD), adds EMA (50,100,200) to determine the local and medium-term trend, and adds certain conditions (Formulas) to determine entry points and signal generation.
This is the first version of the indicator, and it will be improved and updated. This indicator is provided for informational purposes only.
Индикатор Trendoman "Торговые сигналы"
What does it do and how to use it?
This script was written for me, so I made it for my main timeframe, which is 1D. This is the timeframe I tested it on (Russian and US stock market)
When adding the indicator to the chart, open the daily timeframe (1D).
What will we see?
⚫️BUY or SELL signals on the chart. They appear after the closing of the trading day candlestick, therefore, as soon as you see this signal, you can open a trade (In the settings, you can use (Alert Notification) so that when the signal appears, a notification is triggered on a specific instrument.
⚫️Notification preparation "Prep" on the chart. THIS IS NOT A SIGNAL, it is a regular notification when the price enters the overbought or oversold zone. We use this to set Take-Profit and Stop-lose, as well as to understand that it is dangerous to buy in the overbought zone, and to sell in the oversold zone. If you do not need them, you can disable them in the settings.
⚫️The line in the middle. This is a moving average, which shows the direction of the trend (In the settings
Stop-lose and Take-Profit
Trying to build into this indicator the ability to automatically set Stop-lose and Take-Profit did not lead to anything. The main problems are completely different situations at the time of the signal (Mathematically it is not calculated). Have to count yourself.
To set Stop-lose after the signal.
1. Look at the previous local minimum (If the signal is to buy or local maximum (If the signal is to sell). It can be the body of a candle, the shadow of a candle, or a specific level. The stop is always placed below this level, range, or local minimum or maximum.
To set the Take-Profit after the signal is given. There are several options.
1. Mark the levels. Look at an important support or resistance range, fix part of the position at the level, and set the stop for the remainder at breakeven (Entry Price)
2. Make a risk of 1 to 1. If you do not define levels and markup well, then after changing the Stop-lose, you can put the first take on the same%. Example:
Stop-lose и Take-Profit
When you can't open a position EVEN if the indicator shows a signal.
⚫️ If the indicator shows a signal (BAY or SELL), and the signal candle or the previous one opens with a gap. CANCELLED SIGNAL.
⚫️ If the signal candle has a large impulse (down or up). It's very easy to check, take the last 10 candles, if it's higher than the average, it's better to skip this signal (long stop)
⚫️Illiquid instruments. The second and third echelons are often pumped by market participants. Indicators and candles do not work stably. Do not trade illiquid instruments using this indicator.
Risk management.
As noted above, it is impossible to calculate the exact Stop-lose and Take-Profit mathematically, as each situation is unique (levels, highs, lows, slopes, etc. differ).
If you see that your Take-Profit is less than your Stop-lose, it is best to ignore such a trade (depending on your risk tolerance).
Try to open trades where the Take-Profit is greater than the Stop-lose.

Supply & Demand Limited [DOSALGO]The Supply & Demand Limited indicator is a powerful tool designed to automatically identify and plot significant supply and demand zones on your chart. Based on the core principles of price action, this indicator pinpoints areas where buying or selling pressure has historically been strong enough to cause a substantial shift in the market. By visualizing these key institutional levels, traders can gain a clearer perspective on potential turning points, support/resistance areas, and high-probability trade setups.
This "Limited" version is specifically optimized for higher timeframe analysis and will function exclusively on Daily and Weekly charts, helping traders focus on the most significant market structure.
Key Features
Automatic Zone Detection: The indicator's internal calculation method scans the price action to detect valid supply and demand zones, saving you the time and effort of manual charting.
Identifies Key Patterns: It recognizes classic supply and demand patterns, including Rally-Base-Drop (RBD), Drop-Base-Rally (DBR), and continuation patterns like Rally-Base-Rally (RBR) and Drop-Base-Drop (DBD).
Dynamic Zone Interaction: Zones are not static. The indicator tracks price interaction, changing a zone's color once it has been touched. It can also automatically remove zones that have been significantly penetrated, keeping your chart clean and relevant.
"Level on Level" (LoL) Detection: A unique feature that identifies when new zones form within or overlapping existing ones. These "stacked" zones can often indicate particularly strong areas of confluence.
Built-in Alerts: Never miss an opportunity. Set up custom alerts to notify you the moment a new supply or demand zone is formed or when the price touches an existing zone.
Fully Customizable: Tailor the indicator to your exact trading style with extensive customization options. Adjust everything from the zone definition and colors to the number of zones displayed on your chart.
How to Use This Indicator
The primary goal of this indicator is to highlight potential areas where the market may reverse or pause.
Identify Potential Reversal Points: A supply zone (red) above the current price may act as resistance, presenting a potential area for short entries. A demand zone (green) below the current price may act as support, offering a potential area for long entries.
Confirm with Other Tools: For best results, use these zones in conjunction with your existing trading strategy. Confirm signals with other indicators, trend analysis, or fundamental factors to increase confidence.
Set Stop-Loss and Take-Profit: The boundaries of the zones can serve as logical guides for placing stop-loss orders (e.g., just above a supply zone or just below a demand zone) and for setting profit targets.
Settings Explained
Zone Definition
Show "Level on Level" (LoL) Labels: Toggles the "(LoL)" text on zones that are stacked on top of each other.
Include Continuation Patterns?: Choose whether to display only reversal patterns (RBD, DBR) or also include continuation patterns (RBR, DBD).
Zone Type: Select how zones are drawn.
Wider: Uses the full high/low of the base candles for a larger zone.
Preferred: Uses a more precise calculation to define the zone, often resulting in a tighter, more refined area.
Max Base Candles in Zone: Sets the maximum number of consolidation (base) candles allowed for a valid zone to be formed.
Zone Display & Limits
Limit Supply/Demand Zones: Toggle on or off to limit the number of zones displayed.
Max Supply/Demand Zones: When the limit is on, this sets the maximum number of the most relevant supply or demand zones to show on the chart.
Zone Interaction
Delete Zone on Deep Wick Penetration?: If enabled, the indicator will automatically remove a zone from the chart if the price penetrates it by a significant amount.
Remove Tested Zone %: Defines how much the price must penetrate a zone (as a percentage of the zone's height) to be considered "deep" and trigger its removal.
Colors & Style
Full customization over the colors for fresh and touched supply and demand zones, as well as the appearance of the zone labels.
Alerts
Alert on New Zone Creation?: Enable to receive an alert when a new zone is confirmed.
Alert on Zone Touch?: Enable to receive an alert when the price first enters an existing zone.
Disclaimer: This indicator is a tool for technical analysis and should not be considered financial advice. All trading involves risk. Always conduct your own research and analysis before making any trading decisions. Past performance is not indicative of future results.

Trade PullBack - EMA Pullback System with Auto Risk-Reward# Trade Pull Back - Professional Pullback Trading System
## 📊 Overview
**Trade Pull Back** is a comprehensive pullback trading system that combines trend-following principles with precise entry timing using candlestick pattern confirmation. This indicator is designed for traders who want to enter trending markets at optimal retracement levels with pre-calculated risk-reward ratios.
---
## 🎯 Core Methodology
### Why This System Works
Most traders struggle with two key challenges:
1. **Entering too early** - jumping into trades before the pullback completes
2. **Entering too late** - missing the momentum after the pullback reverses
This system solves both problems by using a **3-Phase Confirmation Process**:
**Phase 1: Trend Identification** → **Phase 2: Pullback Detection** → **Phase 3: Reversal Confirmation**
---
## 🔧 How It Works
### 1. Triple EMA Framework (The Foundation)
Unlike traditional single EMA systems, this indicator uses **3 separate EMAs** with different purposes:
- **EMA Trend (default: 50)** - Determines the overall market direction
- Source: HL/2 for balanced trend reading
- Acts as the primary filter - we only trade in its direction
- **EMA High (default: 20)** - Dynamic resistance in uptrends
- Source: High prices for accurate resistance mapping
- Entry trigger for bullish setups when price closes above it
- **EMA Low (default: 20)** - Dynamic support in downtrends
- Source: Low prices for accurate support mapping
- Entry trigger for bearish setups when price closes below it
**Why 3 EMAs?**
- Single EMA can't distinguish between trend and pullback zones
- Two EMAs (like MACD) don't provide clear entry/exit levels
- Three EMAs create a **channel system** that identifies both trend direction AND optimal entry zones
### 2. Pattern Recognition Engine
The system detects two high-probability reversal patterns:
#### Engulfing Patterns
- **Bullish Engulfing**: Previous bearish candle completely engulfed by bullish candle
- **Bearish Engulfing**: Previous bullish candle completely engulfed by bearish candle
- Validates: Strong momentum reversal with volume confirmation
#### Pin Bar Patterns
- **Bullish Pin Bar (Hammer)**: Long lower wick (60%+ of total range) rejecting lower prices
- **Bearish Pin Bar (Inverted Hammer)**: Long upper wick (60%+ of total range) rejecting higher prices
- Validates: Institutional rejection at support/resistance levels
**Pattern Quality Filter:**
- Body-to-wick ratio must meet minimum standards
- Checks previous candle momentum
- Requires trend alignment before signaling
### 3. Pullback Confirmation System
The system includes **5 mandatory conditions** before generating a signal:
#### For Bullish Signals (BUY):
1. ✅ Close > EMA Trend (uptrend confirmed)
2. ✅ EMA High > EMA Trend AND EMA Low > EMA Trend (healthy trend structure)
3. ✅ Bullish Engulfing OR Bullish Pin Bar (pattern detected)
4. ✅ Close > EMA High (breakout confirmation)
5. ✅ Optional: Low < EMA High (pullback occurred)
#### For Bearish Signals (SELL):
1. ✅ Close < EMA Trend (downtrend confirmed)
2. ✅ EMA High < EMA Trend AND EMA Low < EMA Trend (healthy trend structure)
3. ✅ Bearish Engulfing OR Bearish Pin Bar (pattern detected)
4. ✅ Close < EMA Low (breakdown confirmation)
5. ✅ Optional: High > EMA Low (pullback occurred)
**Additional Filters:**
- **Consecutive Bars Check**: Ensures pullback had momentum (1-5 bearish/bullish bars)
- **Signal Spacing**: Minimum 4 bars between signals to avoid noise
- **Confirmation Delay**: Signal appears only AFTER bar closes (no repainting)
---
## 💰 Automatic Risk-Reward Calculator
### Smart Position Sizing
When a signal triggers, the system automatically calculates:
**For Long Positions:**
- **Entry**: High of signal candle
- **Stop Loss**: Lower of last 2 candle lows (protects against false breakouts)
- **Target 1 (1R)**: Entry + 1x Risk
- **Target 2 (2R)**: Entry + 2x Risk
- **Target 3 (3R)**: Entry + 3x Risk
**For Short Positions:**
- **Entry**: Low of signal candle
- **Stop Loss**: Higher of last 2 candle highs
- **Targets**: Calculated based on risk multiple
### Auto-Remove Feature
Lines and labels automatically disappear when:
- Price hits Stop Loss (trade invalidated)
- Price reaches 3R target (trade complete)
This keeps your chart clean and focuses only on active trades.
---
## 📈 Multi-Timeframe Trend Analysis
### Confluence Trading
The built-in MTF trend box shows trend status across 7 timeframes simultaneously:
- M1, M5, M15, M30, H1, H4, D1
**Color Coding:**
- 🟢 **Green**: Uptrend (Price > EMA Trend AND EMAs aligned bullish)
- 🔴 **Red**: Downtrend (Price < EMA Trend AND EMAs aligned bearish)
- ⚪ **Gray**: No clear trend
**Why This Matters:**
- Trade with higher timeframe trends for better win rate
- Avoid counter-trend trades when all timeframes show same direction
- Identify divergences between timeframes for reversal opportunities
---
## 🎨 Customization Options
### EMA Settings
- Adjust periods for different trading styles (scalping vs swing trading)
- Choose price sources (HL/2, Close, HLC/3) for sensitivity tuning
### Pattern Selection
- Enable/disable Engulfing patterns
- Enable/disable Pin Bar patterns
- Trade only your preferred pattern type
### Signal Filters
- **Require Pullback**: Force pullback condition (stricter entries)
- **Consecutive Bars**: Set momentum requirement (1-5 bars)
### Display Options
- Show/hide EMA lines
- Show/hide signals
- Enable/disable alerts
- Customize Risk-Reward line styles and extensions
---
## 📋 How to Use This Indicator
### Step 1: Identify the Trend
- Wait for price to establish clear direction relative to EMA Trend (50)
- Check MTF box to confirm higher timeframe alignment
### Step 2: Wait for Pullback
- In uptrend: Watch for price to pull back toward EMA High
- In downtrend: Watch for price to pull back toward EMA Low
### Step 3: Pattern Confirmation
- Look for Engulfing or Pin Bar pattern (triangle/diamond markers)
- Ensure pattern forms at or near the EMA High/Low zone
### Step 4: Entry & Risk Management
- Enter when signal appears (after bar closes)
- Use displayed Stop Loss and Take Profit levels
- Consider partial profits at 1R and 2R, let remainder run to 3R
### Step 5: Trade Management
- If price hits SL, lines disappear automatically (trade invalidated)
- If price reaches 3R, lines disappear (trade complete)
- Consider trailing stop after 1R is reached
---
## ⚙️ Recommended Settings
### For Scalping (M1-M5)
- EMA Trend: 20-30
- EMA High/Low: 10-15
- Require Pullback: OFF
- Consecutive Bars: 1
### For Day Trading (M15-H1)
- EMA Trend: 50 (default)
- EMA High/Low: 20 (default)
- Require Pullback: ON
- Consecutive Bars: 2-3
### For Swing Trading (H4-D1)
- EMA Trend: 100-200
- EMA High/Low: 50
- Require Pullback: ON
- Consecutive Bars: 3-5
---
## ✅ What Makes This Script Original
### 1. Systematic Approach
This isn't just a collection of indicators. It's a **complete trading system** with:
- Defined entry rules (5-point confirmation checklist)
- Automatic risk management (SL/TP calculation)
- Trade validation (consecutive bars, signal spacing)
### 2. Smart EMA Framework
The 3-EMA system creates a **dynamic channel** that adapts to market conditions:
- Trend EMA = Direction filter
- High/Low EMAs = Entry/Exit zones
- Together they form a "trade zone" that standard EMAs can't provide
### 3. Pattern Quality Control
Not all Engulfing or Pin Bar patterns are equal. This system:
- Validates body-to-wick ratios
- Checks previous candle momentum
- Requires trend alignment before signaling
### 4. Auto Risk-Reward Management
Most indicators just show signals. This one:
- Calculates exact entry prices
- Places stop loss at optimal location (lower of 2 lows)
- Projects 3 profit targets based on risk
- Auto-removes when trade is complete/invalidated
### 5. No Repainting
- All signals appear AFTER bar closes
- No future data leaking
- What you see in backtest = what you get in real-time
---
## 🚨 Alerts
Built-in alerts notify you when:
- Bullish signal confirmed
- Bearish signal confirmed
Alerts fire once per bar (no spam) and only after bar closes (no false alerts).
---
## 📊 Best Practices
### ✅ DO:
- Trade in direction of higher timeframe trends
- Wait for full confirmation (all 5 conditions met)
- Use proper position sizing (1-2% risk per trade)
- Let winners run to at least 2R
### ❌ DON'T:
- Trade against major trend on MTF box
- Enter before signal bar closes
- Ignore the Stop Loss level
- Overtrade - respect the 4-bar minimum spacing
---
## 🔍 Limitations
This indicator is a **tool**, not a crystal ball:
- No indicator wins 100% of the time
- False signals occur in choppy/ranging markets
- Best results in trending conditions
- Requires proper risk management
- Should be combined with fundamental analysis and market context
---
## 📚 Educational Value
This script teaches:
- How to combine trend following with mean reversion
- Pattern recognition and validation
- Risk-reward ratio calculation
- Multi-timeframe analysis
- Proper trade entry timing
---
## 🎓 Credits & Disclaimer
**Original Work**: All code written from scratch
**Methodology**: Based on classical technical analysis principles (EMA crossovers, candlestick patterns, support/resistance)
**Disclaimer**: This indicator is for educational purposes. Past performance does not guarantee future results. Always practice proper risk management.
---
## 📞 Support
If you find this indicator helpful:
- Leave a review
- Share with fellow traders
- Provide feedback for improvements
**Note**: This is a closed-source script to protect the proprietary signal logic and filtering algorithms. The description above provides comprehensive understanding of the methodology without revealing exact implementation details.
---
**Version**: 1.0
**Pine Script Version**: 5
**Type**: Indicator (Overlay)
**Category**: Trend Following + Pattern Recognition
---
*Happy Trading! 🚀*
# 🇹🇭 คู่มือภาษาไทย / Thai Guide
# Trade Pull Back - คู่มือภาษาไทย
## 📊 ภาพรวม
**Trade Pull Back** เป็นระบบเทรด Pullback ที่ผสมผสานการเทรดตามเทรนด์กับการจับจังหวะเข้าออเดอร์ด้วย Candlestick Pattern พร้อมคำนวณ Risk-Reward อัตโนมัติ
---
## 🎯 หลักการทำงาน
### ทำไมระบบนี้ได้ผล?
แก้ปัญหา 2 ข้อหลักของเทรดเดอร์:
1. **เข้าเร็วเกินไป** - เข้าก่อน Pullback เสร็จ
2. **เข้าช้าเกินไป** - พลาดโมเมนตัมหลังกลับตัว
**วิธีแก้**: ใช้กระบวนการยืนยัน 3 ขั้นตอน
- **ขั้น 1**: ระบุเทรนด์ → **ขั้น 2**: ตรวจจับ Pullback → **ขั้น 3**: ยืนยันการกลับตัว
---
## 🔧 ส่วนประกอบหลัก
### 1. ระบบ EMA 3 เส้น
ต่างจาก EMA ทั่วไป ระบบนี้ใช้ 3 เส้นที่มีหน้าที่แยกกัน:
- **EMA Trend (50)** - กำหนดทิศทางเทรนด์หลัก
- **EMA High (20)** - แนวต้านไดนามิก (สำหรับ Buy)
- **EMA Low (20)** - แนวรับไดนามิก (สำหรับ Sell)
**ทำไมต้อง 3 เส้น?**
- 1 เส้น = แยกเทรนด์กับ Pullback ไม่ได้
- 2 เส้น = ไม่มีจุด Entry/Exit ชัดเจน
- 3 เส้น = สร้าง Channel ที่บอกทั้งเทรนด์และโซนเข้าออเดอร์
### 2. ตรวจจับ Pattern
ระบบตรวจจับ 2 Pattern หลัก:
**Engulfing (แท่งกลืน)**
- Bullish: แท่งเขียวกลืนแท่งแดงทั้งหมด
- Bearish: แท่งแดงกลืนแท่งเขียวทั้งหมด
**Pin Bar (แท่งหาง)**
- Bullish: หางล่างยาว 60%+ ของช่วงทั้งหมด
- Bearish: หางบนยาว 60%+ ของช่วงทั้งหมด
### 3. เงื่อนไขยืนยันสัญญาณ (5 ข้อ)
**สัญญาณ Buy:**
1. ✅ ราคาปิด > EMA Trend (เทรนด์ขาขึ้น)
2. ✅ EMA High และ Low เหนือ EMA Trend (โครงสร้างดี)
3. ✅ เกิด Bullish Engulfing หรือ Pin Bar
4. ✅ ราคาปิด > EMA High (ยืนยัน Breakout)
5. ✅ ตัวเลือก: มี Pullback มาแตะ EMA High
**สัญญาณ Sell:**
1. ✅ ราคาปิด < EMA Trend (เทรนด์ขาลง)
2. ✅ EMA High และ Low ใต้ EMA Trend (โครงสร้างดี)
3. ✅ เกิด Bearish Engulfing หรือ Pin Bar
4. ✅ ราคาปิด < EMA Low (ยืนยัน Breakdown)
5. ✅ ตัวเลือก: มี Pullback มาแตะ EMA Low
**ตัวกรองเพิ่มเติม:**
- ต้องมีแท่งติดกัน 1-5 แท่ง (กำหนดได้)
- ห่างสัญญาณก่อนหน้าอย่างน้อย 4 แท่ง
- สัญญาณปรากฏหลังแท่งปิดเท่านั้น (ไม่ Repaint)
---
## 💰 คำนวณ Risk-Reward อัตโนมัติ
เมื่อสัญญาณเกิด ระบบคำนวณให้อัตโนมัติ:
**Long Position:**
- Entry = High ของแท่งสัญญาณ
- Stop Loss = Low ที่ต่ำกว่าของ 2 แท่งล่าสุด
- Target = 1R, 2R, 3R
**Short Position:**
- Entry = Low ของแท่งสัญญาณ
- Stop Loss = High ที่สูงกว่าของ 2 แท่งล่าสุด
- Target = 1R, 2R, 3R
**ลบอัตโนมัติ:** เส้นหายเมื่อราคาชน SL หรือถึง 3R
---
## 📈 กล่องเทรนด์หลาย Timeframe
แสดงเทรนด์พร้อมกัน 7 Timeframe:
- M1, M5, M15, M30, H1, H4, D1
**สีแสดงผล:**
- 🟢 เขียว = Uptrend
- 🔴 แดง = Downtrend
- ⚪ เทา = ไม่มีเทรนด์
**ประโยชน์:** เทรดตาม Timeframe ใหญ่เพื่อเพิ่ม Win Rate
---
## 📋 วิธีใช้งาน (5 ขั้นตอน)
1. **ระบุเทรนด์** - เช็คราคาเทียบกับ EMA Trend และกล่อง MTF
2. **รอ Pullback** - เฝ้าราคา Pullback มาที่ EMA High/Low
3. **เช็ค Pattern** - มองหาลูกศรสามเหลี่ยม (Engulfing) หรือเพชร (Pin Bar)
4. **เข้าออเดอร์** - เข้าเมื่อสัญญาณปรากฏ ใช้ SL/TP ที่แสดง
5. **จัดการเทรด** - เส้นจะหายเองเมื่อชน SL หรือถึง 3R
---
## ⚙️ การตั้งค่าแนะนำ
**Scalping (M1-M5)**
- EMA Trend: 20-30
- EMA High/Low: 10-15
- Require Pullback: ปิด
**Day Trading (M15-H1)**
- EMA Trend: 50 (ค่าเริ่มต้น)
- EMA High/Low: 20 (ค่าเริ่มต้น)
- Require Pullback: เปิด
**Swing Trading (H4-D1)**
- EMA Trend: 100-200
- EMA High/Low: 50
- Require Pullback: เปิด
---
## ✅ จุดเด่นที่แตกต่าง
1. **เป็นระบบสมบูรณ์** - ไม่ใช่แค่รวม Indicator
2. **EMA 3 เส้นสร้าง Channel** - บอกทั้งเทรนด์และโซนเข้า
3. **ตรวจสอบคุณภาพ Pattern** - ไม่ใช่ทุก Pattern ที่ให้สัญญาณ
4. **คำนวณ RR อัตโนมัติ** - วาง SL/TP ให้เลย
5. **ไม่ Repaint** - สัญญาณปรากฏหลังแท่งปิดเท่านั้น
---
## 📊 ควรทำ / ไม่ควรทำ
### ✅ ควรทำ:
- เทรดตามเทรนด์ Timeframe ใหญ่
- รอยืนยันครบ 5 เงื่อนไข
- เสี่ยง 1-2% ต่อเทรด
- ปล่อยกำไรไปอย่างน้อย 2R
### ❌ ไม่ควรทำ:
- เทรดทวนเทรนด์ในกล่อง MTF
- เข้าก่อนแท่งปิด
- ละเลย Stop Loss
- เทรดบ่อยเกินไป
---
## 🔍 ข้อจำกัด
- ไม่มี Indicator ไหนชนะ 100%
- สัญญาณผิดพลาดเกิดในตลาด Sideways
- ผลดีสุดในตลาดที่มีเทรนด์ชัด
- ต้องใช้ Money Management
- ควรดูปัจจัยพื้นฐานประกอบ
---
## 🎓 คำเตือน
**Disclaimer**: อินดิเคเตอร์นี้สำหรับการศึกษา ผลในอดีตไม่รับประกันอนาคต ใช้ Risk Management ที่เหมาะสมเสมอ
---
**เวอร์ชั่น**: 1.0
**Pine Script**: v5
**ประเภท**: Indicator (Overlay)
*Happy Trading! 🚀*
## Screenshots
**Bearish Signals with Risk-Reward:**
! (drive.google.com)
**Bullish Signal with Risk-Reward:**
! (drive.google.com)
**Multi-Timeframe Trend Box:**
! (drive.google.com)
**Settings Panel:**
! (drive.google.com)

Breakout Levels Checklist# Description (EN)
## Breakout Levels Checklist — ATR (Classic shown, Active = 5-Day Median or Manual), D1-Fixed, Risk Position Sizing
This script is an on-chart checklist for breakout trades with a daily-fixed ATR core and a simple risk calculator. ATR values are latched on **D1**, so SL/TP remain stable when you switch timeframes. The UI (inputs and panel) is in Russian.
### What it does
- **Checklist**: three groups (Prerequisites, Negatives, Waiting). You tick items; the panel shows a clean list with counters.
- **Breakout calculations**: Entry, Stop-Loss, Take-Profit from your level price, **k × ATR** stop, and an RR preset. A built-in entry offset ≈ **12.5%** of the stop distance is applied.
- **ATR engine (D1)**:
- **Classic ATR** (period selectable; HL or True Range) — **always computed and displayed** for reference and daily progress.
- **Active ATR** = either **5-day median ATR** with optional *paranormal bar* filter (filters both too-big and too-small D1 ranges by percentage thresholds vs a blended reference), **or Manual ATR** if enabled.
- **Risk calculator**: given **Deposit** and **Risk %**, the script outputs the **entry notional (USD)** so an SL hit is approximately equal to your dollar risk; the panel also shows potential PnL to take-profit.
- **Stable visuals**: level / entry / SL / TP lines with automatic cleanup on a new day; panel can be placed in any corner (RU labels).
### How to use
1. Set **Direction** (Long/Short) and the **Level Price**.
2. Tick checklist items as the setup forms.
3. In **ATR**, leave Classic as reference (period + HL/TR), and choose the **Active ATR mode**: *5-day median* (with optional paranormal filter) **or** *Manual* (manual value overrides).
4. Pick **k** for **Stop = k × ATR**; TP is placed by the **RR** preset relative to stop size.
5. In **Calculator**, set **Deposit** and **Risk %** — the panel returns the **entry notional** aligned with your risk.
6. Show/hide panel sections (calculations / ATR / calculator) as needed.
### Quick notes
- Classic ATR is not selectable; it is always calculated and shown for context and D1 progress.
- Active ATR drives stop sizing: *5-day median (with filter)* or *Manual*.
- All ATR computations use **closed D1 bars**; values are cached per day.
---
# Описание (RU)
## Чек-лист уровней (Пробой) — ATR (классический показывается, Активный = медианный 5-дневный или Ручной), фиксация D1, расчёт позиции от риска
Скрипт для работы с пробойными сетапами: чек-лист на графике, фиксированный дневной ATR, расчёт ТВХ/SL/TP и простой калькулятор позиции от риска. Значения ATR фиксируются на **D1**, поэтому SL/TP не «плавают» при смене таймфреймов. Интерфейс (входы и панель) — на русском.
### Что делает
- **Чек-лист**: три группы (Предпосылки, Минусы, Ожидаю). Отмечаете галочки — панель выводит список и счётчики.
- **Расчёты пробоя**: ТВХ, Стоп-лосс, Тейк-профит от цены уровня; стоп как **k × ATR**; тейк задаётся пресетом **RR**; встроен люфт входа ≈ **12.5%** от дистанции стопа.
- **ATR (D1)**:
- **Классический ATR** (период, HL или True Range) — **всегда считается и показывается** как справочное значение и для прогресса дня.
- **Активный ATR** = **медианный за 5 дней** с опциональным фильтром *паранормальных* баров (одной галочкой отсекаются одновременно слишком большие и слишком маленькие дневные диапазоны по процентным порогам к смешанному референсу) **или** **Ручной ATR** (ручное значение имеет приоритет).
- **Калькулятор риска**: по **Депозиту** и **Риску %** отдаёт **сумму входа (USD)** так, чтобы убыток по стопу был близок к заданному риску; дополнительно показывает потенциальный PnL по тейку.
- **Стабильная отрисовка**: линии Уровень / ТВХ / SL / TP, авто-очистка на новый день; позиция панели выбирается (русские подписи углов).
### Как работать
1. Задайте **Направление** (Long/Short) и **Цену уровня**.
2. Отметьте пункты чек-листа под текущий контекст.
3. В **ATR** используйте **Классический** как справочный (период + HL/TR), а **Активный ATR** выберите как *медианный 5-дневный* (с фильтром при необходимости) **или** *Ручной* (ручное значение замещает активный).
4. Укажите **k** для **Стоп = k × ATR**; тейк выставляется пресетом **RR** относительно размера стопа.
5. В **Калькуляторе** задайте **Депозит** и **Риск %** — получите **сумму входа**, согласованную с риском.
6. В панели можно скрывать/показывать секции (расчёты / ATR / калькулятор).
### Важные примечания
- Классический ATR не выбирается пользователем — он всегда считается и отображается для контекста и прогресса по дню.
- Активный ATR используется для расчёта стопа: медианный 5D (с фильтром) или ручной.
- Все расчёты ATR делаются по **закрытым барам D1**; значения кэшируются на день.
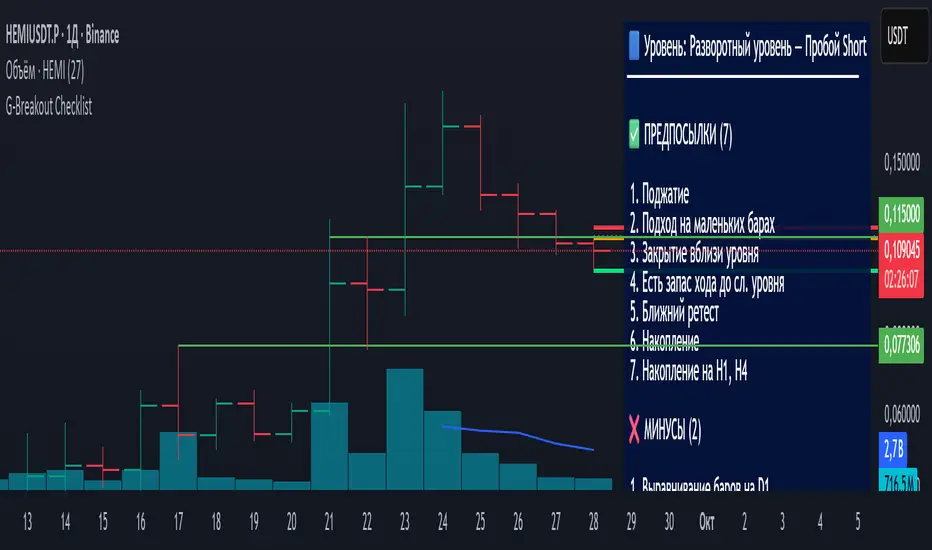
Trend TraderThe Trend Trader indicator is a trend-following tool based on a triple EMA (Exponential Moving Average) setup designed to help traders identify market direction and potential reversal zones. It plots three customizable EMAs on the chart to highlight bullish and bearish momentum, then generates trade signals when price shows a strong likelihood of continuing in the direction of the prevailing trend.
EMA Alignment: The indicator checks for bullish stacking (fast EMA above medium, medium above slow) and bearish stacking (fast EMA below medium, medium below slow). This alignment defines the prevailing market trend.
Trend Validation: A user-defined lookback period ensures signals are only taken if the market recently displayed a stacked trend, thus filtering false entries during consolidations.
Signal Generation: Buy signals appear when price dips into the zone between the fast and medium EMAs during a bullish trend. Sell signals appear when price rallies into the zone between the fast and medium EMAs during a bearish trend.
Alerts: Built-in alerts notify traders of new trade opportunities without having to constantly watch the chart.
This indicator is suitable for swing trading and intraday strategies across multiple markets, including forex, stocks, indices, and crypto.
Suggested Strategy for Profitability
This tool is best used as part of a structured trend-trading plan. Below is a suggested framework:
Entry Rules
Long (Buy Trade):
Confirm that EMA alignment is bullish (EMA1 > EMA2 > EMA3).
Wait for a Buy Signal (triangle up below price).
Ensure the higher timeframe (e.g., 4H if trading 1H) trend is also bullish to filter trades.
Short (Sell Trade):
Confirm EMA alignment is bearish (EMA1 < EMA2 < EMA3).
Wait for a Sell Signal (triangle down above price).
Higher timeframe should also be bearish to increase probability.
Stop Loss
For long positions, place the stop loss just below EMA3 or the most recent swing low.
For short positions, place the stop loss just above EMA3 or the most recent swing high.
Take Profit
Conservative: Set TP at 1.5x to 2x the stop loss distance.
Aggressive: Trail stop loss below EMA2 (for longs) or above EMA2 (for shorts) to capture larger trends.
Risk Management
Use no more than 1–2% of account risk per trade.
Trade only when the signal aligns with overall market context (higher timeframe, support/resistance, or volume confirmation).
This indicator is very similar to the indicator "Trend Scalper" by the same developer, the difference is this indicator is used to just find the trade and hold the trade or to find the reversal of a trend instead of triggering alerts every time price enters between EMA1 and EMA2.
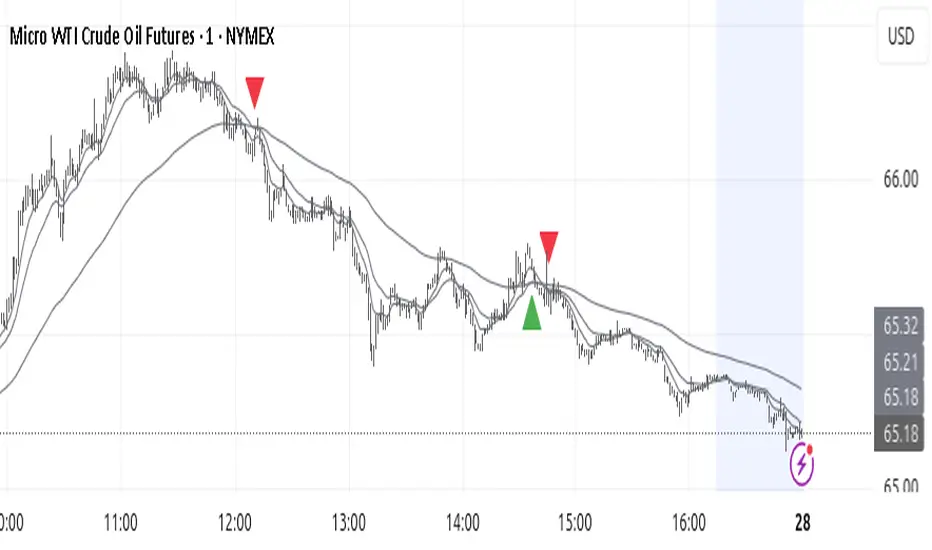
Altcoins Exit Executor: 3Commas-Integrated [SwissAlgo]Title: Altcoins Exit Executor: 3Commas-Integrated
Plan and Execute your Altcoins Exits via 3Commas Integration
------------------------------------------------------------------
1. Facing These Struggles?
You're holding a portfolio of altcoins, and the question keeps nagging you: when should you exit? how?
If you're like many crypto traders, you might recognize these familiar struggles:
The Planning Problem : You know you should have an exit strategy, but every time you sit down to plan it, you get overwhelmed. Should you sell at 2x? 5x? What about that resistance level you spotted last month? You end up postponing the decision again and again.
The Execution Headache : You use 3Commas (or an Exchange directly) for your trades, but setting up Smart Trades for multiple coins means endless manual data entry. Price levels, percentages, quantities - by the time you finish entering everything, the market may have already moved.
The Portfolio Scale Problem : Managing 5 altcoins is challenging enough, but what about 15? Or 30? The complexity grows exponentially with each additional position. What started as a manageable analysis for a few coins becomes an overwhelming juggling act that may lead to rushed decisions or complete paralysis.
The Consistency Challenge : You approach each coin differently. Maybe you're conservative with one position and aggressive with another, without any systematic reasoning. Your portfolio becomes a patchwork of random decisions rather than a coherent strategy. With dozens of positions, maintaining any consistent approach becomes nearly impossible.
The "What If" Anxiety : What happens if the market crashes while you're sleeping? You know you should have stop-losses, but setting them up properly across multiple positions feels overwhelming. The more coins you hold, the more potential failure points you need to monitor.
The Information Overload : You collect multiple data points, but how do you synthesize all this information into actionable exit points? Multiply this analysis across 20+ different altcoins, and the task becomes nearly impossible to execute consistently.
This indicator may help address these challenges by providing you with:
A systematic approach to analyzing potential resistance levels across multiple technical frameworks. All potential resistances (including Fibonacci levels) are calculated automatically
Tools to structure your exit plan with clear take-profit levels and position sizing
Automated generation of 3Commas 'Smart Trades' that match your exit strategy exactly, without manual entry
Optional emergency exit protection that could potentially guard against sudden market reversals (exit managed within the 3Commas 'Smart Trade' itself)
A consistent methodology you can apply across your entire altcoin portfolio, regardless of size
The goal is to transform exit planning from a source of stress and procrastination into a structured, repeatable process that may help you execute your trading plan in a consistent fashion, whether you're managing 3 coins or 30.
------------------------------------------------------------------
2. Is this for You?
This indicator is designed for cryptocurrency traders who:
Hold a portfolio of multiple altcoins (typically 5+ positions)
Are actively seeking a systematic solution to plan and execute exit strategies
Have an active 3Commas account connected to their exchange
Understand 3Commas basics: Smart Trades, API connections, and account management
Have an account tier that supports their portfolio size (3Commas Free Plan: up to 3 trades/alts, Pro Plan: up to 50+ trades/alts)
Important: This tool provides analysis and automation assistance, not trading advice. All exit decisions require your individual judgment and proper risk management.
If you don't use 3Commas, you may still find value in the resistance analysis components, though the automated execution features require a 3Commas account and basic platform knowledge.
------------------------------------------------------------------
3. How does it work?
This indicator streamlines your exit planning process into four steps:
Step 1: Analyze Your Coin & Define Exit Plan
The indicator automatically calculates multiple types of resistance levels that may act as potential exit points:
Fibonacci Extensions (projected resistance from recent price swings)
Fibonacci Retracements (resistance from previous cycle highs)
Major Pivot Highs (historical price rejection points)
Volume Imbalances (PVSRA analysis showing institutional activity zones)
Price Multipliers (2x, 3x, 4x, 5x psychological levels)
Market Trend Analysis (bull/bear market strength assessment)
You can view all resistance types together or focus on specific categories to identify potential exit zones.
Step 2: Enter Your Exit Plan.
Define your sequential take-profit strategy:
Set up to 5 take-profit levels with specific prices
Assign percentage of coins to sell at each level
Add your total coin quantity and average entry price
Optionally enable emergency exit (stop-loss) protection. The indicator validates your plan in real-time, ensuring percentages sum to 100% and prices follow logical sequences.
Step 3: Connect with 3Commas
Relay Secret
3Commas API keys (Public and Private)
Account ID (your exchange account on 3Commas)
Step 4: Generate Smart Trade on 3Commas
Create a TradingView alert that automatically:
Sends your complete exit plan to 3Commas
Creates a Smart Trade with all your take-profit levels
Includes stop-loss protection if enabled
Requires no manual data entry on the 3Commas platform
The entire process is designed to streamline the time required to move from analysis to execution, providing a standardized methodology across your altcoin positions.
User Experience Features:
Step-by-step guided workflow
Interactive submission helper with status tracking
Exit plan table with detailed projections
Comprehensive legend and educational tooltips
Dark/light theme compatibility
Organized visual presentation of all resistance levels
------------------------------------------------------------------
4. Using the Indicator
Complete the 4-step guided workflow within the indicator to set up an Exit Plan and submit it to 3Commas.
At the end of the process, you will see a Smart Trade created on 3Commas reflecting your custom Exit Plan (inclusive of Stop Loss, if enabled).
Recommended Settings
Analyze your Exit Plan on the 1-Day timeframe
Use the Tradingview's Dark-Theme for high visual contrast
Set candles to 'Bar-Type' to view volumr-based candle colors (PVSRA analysis)
Use desktop for full content visibility
Analyzing Resistance Levels
Enable "Show all Resistance Levels" to view comprehensive analysis across your chart
Focus on resistance clusters where multiple resistance seem to converge - these may indicate stronger potential exit zones
Note the color-coded system: gray lines indicate closer levels, red lines suggest stronger resistance or potentially "out-of-reach" targets
Pay attention to the Golden Zone (Fibonacci 0.618-0.786 area) highlighted in green, it might act as a significant price magnet for average altcoins
Decide how many Take Profit Steps to use (min. 1 - max- 5)
Setting up your Plan
Enter the total number of coins you want to sell with the script
Enter your average entry price, if known (otherwise the script will use the current price as backup)
Enter the TP levels you decided to activate (price, qty to sell at each TP level)
Decide about the Emergency Exit (the price that, when broken, will trigger the sale of 100% of your coins with a close limit order)
Setting Up Your 3Commas Connection
Generate API keys in your 3Commas account with (User Profile→3Commas API→New API Access Token→System Generated→Permission: "Smart Trades Only" (leave all other permissions unchecked) + Whitelisted IP→Create→Save API public/private key securely)
Find your Account ID in the 3Commas exchange URL (My Portfolio→View Exchange→Look at the last number in the url of the webpage - should be a 8-digit number)
Enter all credentials in the indicator's connection section
Verify the green checkmarks appear on the Exit Table, confirming that plan and connection are validated
Deploying Your Plan
Check box "Step 1: Check and confirm Exit Plan" in section 4 of User Settings
Create a TradingView alert (Alert→Select Altcoins Exit Planner PRO→Any alert() function call→Interval Same as Chart→Open Ended→Message: coin name→Notifications: enable Webhook→save and exit
Your Smart Trade appears automatically in 3Commas within minutes
IMPORTANT: Delete the alert after successful deployment to prevent duplicated Smart Trades
To modify the Exit Plan: Delete the Smart Trade on 3Commas and repeat the process above
Monitor your Smart Trade execution through your 3Commas dashboard
Important Notes
Always verify your plan in the Exit Table before deployment
Test with smaller positions initially to familiarize yourself with the process
The indicator provides analysis - final trading decisions remain yours
Manage your API keys and Relay secret with caution: do not share with third parties, store them securely, use malware protection on your PC
Your API keys, trading data, and credentials are transmitted securely through direct API connections and are never stored, logged, or accessible to the indicator author - all communication occurs directly between your browser and the target platforms that support the service.
------------------------------------------------------------------
5. Understanding the Resistance Analysis
Fibonacci Extensions: Calculated from three key points: 2022 bear market bottom → early 2024 bull market high → 2025 retracement low. These project where price might encounter resistance during future rallies based on mathematical ratios (0.618, 1.0, 1.618, 2.0, etc.).
Fibonacci Retracements: For established altcoins: calculated from 2021 cycle peak to 2022 bottom. For newer altcoins: from all-time high to subsequent major low. These show potential resistance zones where price may struggle to reclaim previous highs.
Major Pivot Highs: Historical price levels where significant reversals occurred. These act as potential resistance because traders may remember these levels and place sell orders near them.
Volume Imbalances (PVSRA) : Areas where price moved rapidly on abnormal volume, creating gaps that may attract future price action or orders. The indicator uses volume-to-price-range analysis (PVSRA candles or "Vector Candles") to identify these zones.
Price Multipliers: Reference lines showing 2x, 3x, 4x, 5x current price to help you assess the feasibility of your exit targets. These serve as a "reality check" - if you're setting a take-profit at 4x current price, you can quickly evaluate whether that level seems reasonable given current market conditions and your risk tolerance.
Market Trend Analysis: Uses EMA combined with ADX/DMI indicators to assess current market phase (bull/strong bull, bear/strong/bear, weakening trend)
This technical foundation helps explain why certain price levels appear as potential exit zones, though market conditions ultimately determine actual price behavior.
------------------------------------------------------------------
6. FAQs
GENERAL FAQS
Can I use one indicator for multiple altcoins?
Answer: No, each altcoin needs its own chart layout with a separate indicator installation. Resistance levels are calculated from each coin's unique price history, and your exit plan will be different for each position. When you deploy an alert, it creates one Smart Trade on 3Commas for that specific coin only.
To manage multiple coins, create separate TradingView layouts for each altcoin, configure the indicator individually on each chart, then deploy one alert per coin when ready to execute. This ensures each position gets personalized analysis and allows different exit strategies across your portfolio.
EXIT PLAN ANALYSIS/RESISTANCE LEVELS
Are resistance lines calculated automatically by the script?
Answer: Yes, all resistance lines are calculated automatically based on your coin's price history and market data. You don't need to manually identify or draw any levels. The script analyzes historical pivots, calculates Fibonacci ratios from key price swings, identifies volume imbalance zones, and plots everything on your chart.
Simply enable "Show all Resistance Levels" in the settings and the indicator will display all potential resistance zones with color-coded lines and labels showing the exact price levels and their significance.
What's the difference between Fibonacci Extensions and Fibonacci Retracements?
Answer: Fibonacci Retracements look at completed moves from the past and show where price might struggle to reclaim previous highs. For established coins, they're calculated from 2021 peaks down to 2022 bottoms.
Fibonacci Extensions project forward from recent price swings to estimate where ongoing rallies might encounter resistance. They use three points: 2022 bottom, 2024 high, and 2025 retracement low.
Retracements ask "where might recovery stall based on old highs" while Extensions ask "where might this current rally run into trouble." Both use the same mathematical ratios but different reference points to give you complementary resistance perspectives.
Why are some resistance lines gray and others red?
Answer: The color coding helps you assess the potential difficulty of reaching different resistance levels. Gray lines represent closer resistance levels, while red lines indicate stronger resistance or potentially "out-of-reach" targets that may require exceptional market conditions to break through.
This visual system helps you prioritize your exit planning by distinguishing between near-term targets and more ambitious longer-term objectives when setting your take-profit levels.
What is the resistance from major pivot highs?
Answer: Major pivot highs are historical price levels where significant reversals occurred in the past. These levels often act as resistance because traders remember these previous "ceiling" points where price failed to break higher and may place sell orders near them again.
The indicator automatically identifies these pivot points from your coin's price history and draws horizontal lines at those levels. When price approaches these areas again, it may struggle to break through due to psychological resistance and clustered sell orders from traders who expect similar rejection patterns.
What is the resistance from abnormal volumes?
Answer: Volume imbalances occur when price moves rapidly on abnormally high volume, creating gaps or zones where institutions moved large amounts quickly. These areas often act as resistance when price returns to them because institutional traders may want to "fill" these gaps or add to their positions at those levels.
The indicator uses PVSRA analysis to identify candles with abnormal volume-to-price ratios and marks these zones on your chart. When price approaches these imbalance areas again, it may encounter resistance from institutional activity or algorithmic trading systems programmed to react at these levels.
What are price multipliers?
Answer: Price multipliers are reference lines showing 2x, 3x, 4x, and 5x the current price. They serve as a reality check when setting your take-profit targets. If you're considering a take-profit at $10 and current price is $2, you can quickly see that's a 5x target and evaluate whether that seems realistic given current market conditions.
These lines help you assess the feasibility of your exit goals and avoid setting unrealistic expectations. They're not resistance levels themselves, but visual aids to help you gauge whether your planned targets are conservative, aggressive, or somewhere in between
How is the EMA calculated and why does it represent bull/bear market intensity?
Answer: The indicator uses a 147-period EMA (1D tf) combined with ADX and DMI indicators to assess market phases. The EMA provides the basic trend direction - when price is above the EMA, it suggests bullish conditions, and when below, bearish conditions.
The intensity comes from the ADX/DMI analysis. Strong bull markets occur when price is above the EMA, ADX is above 25 (indicating strong trend), and the positive directional indicator dominates. Strong bear markets show the opposite pattern with negative directional movement dominating.
The system also uses weekly ADX slope to confirm trend strength is increasing rather than fading. This combination helps distinguish between weak sideways markets and genuine strong trending phases, giving you context at the time of exit planning.
EXIT PLAN
Why does my exit plan show errors?
Answer: The indicator validates your plan in real-time and shows specific error messages to help you fix issues. Common problems include take-profit percentages that don't sum to exactly 100%, price levels set in wrong order (TP2 must be higher than TP1), or gaps in your sequence (you can't use TP3 without filling TP1 and TP2 first).
Check the Exit Plan Validation section in the table - it will show exactly what needs fixing with messages like "TP percentages must sum to exactly 100%" or "Fill TPs consecutively starting from TP1." Fix the highlighted issue and the error will clear automatically, turning your validation checkmark green when everything is correct.
Why do I need to provide my coin quantity and average entry price?
Answer: The coin quantity is essential because the indicator calculates exact amounts to sell at each take-profit level based on your percentages. If you set TP1 to sell 25% of your position, the script needs to know your total quantity to calculate that 25% means exactly X coins in your 3Commas Smart Trade.
The average entry price helps calculate your projected gains and portfolio performance in the Exit Table. If you don't know your exact entry price, leave it at zero and the indicator will use current price as a fallback for calculations. Both pieces of information ensure your Smart Trade matches your actual position size and gives you accurate profit projections.
What is the emergency exit price?
Answer: The emergency exit price is an optional stop-loss feature that automatically sells 100% of your coin position if price falls to your specified level. This is critical to understand because once triggered, 3Commas will execute the sale immediately without further confirmation.
When price hits your emergency exit level, 3Commas places a limit sell order at 3% below that price to avoid poor market execution. However, execution is not guaranteed because limit orders may not fill during extreme volatility or if price gaps below your limit level. Use this feature cautiously and set the emergency price well below normal support levels to account for typical market fluctuations.
This sells your entire position regardless of your take-profit plan, so only enable it if you want automated crash protection and understand the risks of potential false breakdowns triggering unnecessary exits.
3COMMAS CONNECTION
How do I get my 3Commas API keys and Account ID?
Answer:
For API Keys: Log into 3Commas, go to User Profile → 3Commas API → New API Access Token → System Generated. Set permissions to "Smart Trades Only" (leave all other permissions unchecked) and add your IP to the whitelist for security. Save both the public and private keys securely after creation.
For Account ID: Go to My Portfolio → View Exchange in 3Commas. Look at the URL in your browser - the Account ID is the 8-digit number at the end of the webpage address (example: if the URL shows "/accounts/12345678" then your Account ID is 12345678).
Important: Never share these credentials with anyone. The indicator transmits them directly to 3Commas through secure API connections without storing or logging them. If you suspect your keys are compromised, revoke them immediately in your 3Commas account and generate new ones.
ALERTS
I have set up my exit plan, what's next?
Answer: Once your exit plan is configured and shows green checkmarks in the validation section, follow the 4-step workflow in the indicator. Check "Step 1: Check and confirm Exit Plan" to enable alert firing, then create a TradingView alert using the Altcoins Exit Planner PRO condition with "Any alert() function call" trigger.
The alert fires immediately and sends your plan to 3Commas. Within minutes, you should see a new Smart Trade appear in your 3Commas dashboard matching your exact exit strategy. After confirming the Smart Trade was created successfully, delete the TradingView alert to prevent duplicate submissions.
From that point, 3Commas manages your exit automatically according to your plan. Monitor execution through your 3Commas dashboard and let the platform handle the sequential take-profit levels as price moves.
How do I create the TradingView alert?
Answer: Click the "Alert" button in TradingView (bell icon in the top toolbar). In the alert setup window, set Condition to "Altcoins Exit Planner PRO" and Trigger to "Any alert() function call." Keep Interval as "Same as Chart" and Expiration as "Open Ended."
In the Message section, you can name your alert anything you want. In the Notifications section, enable the webhook option (leave the URL field as you'll handle that separately). You can also enable email or sound notifications if desired.
Click "Create" to activate the alert. If Step 1 is already checked in your indicator, the alert will fire immediately and send your exit plan to 3Commas. Remember to delete this alert after your Smart Trade appears to prevent duplicates.
I got the Smart Trade on 3Commas, what's next?
Answer: Congratulations! Your exit plan is now active and automated. Delete the TradingView alert immediately to prevent duplicate Smart Trades from being created. You can now monitor your Smart Trade's progress through your 3Commas dashboard.
3Commas will automatically execute your take-profit levels as price reaches each target, selling the specified percentages of your position according to your plan. If you enabled emergency exit protection, that stop-loss is also active and monitoring for downside protection.
Your job is essentially done - let 3Commas handle the execution while you monitor overall market conditions. You can view trade progress, modify the Smart Trade if needed, or manually close it early through your 3Commas interface. The platform will manage all the sequential selling according to your original exit strategy.
Can I cancel my exit plan and resubmit to 3Commas?
Answer: Yes, you can modify your exit strategy by first deleting the existing Smart Trade in your 3Commas dashboard, then resubmitting a new plan through the indicator.
To cancel and resubmit: Go to your 3Commas Smart Trades section and delete the current trade. Return to the TradingView indicator, modify your exit plan settings (prices, percentages, emergency exit, etc.), then repeat the deployment process by checking Step 1 and creating a new alert.
This creates a fresh Smart Trade with your updated parameters. Always ensure you delete the old Smart Trade first to avoid having multiple conflicting exit plans running simultaneously. The new deployment will overwrite nothing automatically - you must manually clean up the old trade before submitting the revised plan.
Why did I get a second Smart Trade after the first one?
Answer: This happens when you forget to delete the TradingView alert after your first Smart Trade was created successfully. The alert remains active and continues firing, creating duplicate Smart Trades each time it triggers.
Always delete your TradingView alert immediately after confirming your Smart Trade appears in 3Commas. Go to your TradingView alerts list, find the alert you created for this exit plan, and delete it completely. Also delete any duplicate Smart Trades in your 3Commas dashboard to avoid confusion.
To prevent this in future deployments, remember the workflow: create alert → Smart Trade appears → delete alert immediately. Each exit plan should only generate one Smart Trade, and keeping alerts active will cause unwanted duplicates.
------------------------------------------------------------------
7. Limitations and Disclaimer
Limitations:
Doesn't provide trading signals or entry points
Doesn't guarantee resistance levels will hold
Requires manual monitoring of 3Commas execution
Works for exit planning only, not position building
Disclaimer
This indicator is for educational and informational purposes only. It does not constitute financial, investment, or trading advice.
The indicator:
Makes no guarantees about future market performance
Cannot predict market movements with certainty
May generate false indications
Relies on historical patterns that may not repeat
Should not be used as the sole basis for trading decisions
Users are responsible for:
Conducting independent research and analysis
Understanding the risks of cryptocurrency trading
Making their own investment/divestment decisions
Managing position sizes and risk exposure appropriately
Managing API keys and secret codes diligently (do not share with third parties, store them securely, use malware protection on your PC)
Cryptocurrency trading involves substantial risk and may not be suitable for all investors. Past performance does not guarantee future results. Users should only invest what they can afford to lose and consult qualified professionals before making financial decisions.
The indicator’s assumptions may be invalidated by changing market conditions.
By using this tool, users acknowledge these limitations and accept full responsibility for their trading decisions.

Trader Marks Trailing SL + TP (BE @ 60%)This script provides a unique stop-loss and take-profit management tool designed for swing traders.
It introduces a two-stage stop-loss logic that is not available in standard TradingView tools:
Break-Even Protection: Once a defined profit threshold (e.g. 66%) is reached, the stop-loss automatically moves to break-even.
ATR-Based Trailing Stop: After a chosen delay (e.g. 12 hours), the script activates a dynamic trailing stop that follows market volatility using the ATR.
Flexible Ratchet Mechanism: The stop-loss can be locked at new profit levels and will never move backwards.
This combination allows traders to secure profits while still giving the trade room to develop. The indicator is especially useful for swing trading on 4H and daily timeframes but can be applied to other styles as well.
How to use:
Enter your entry price, stop-loss, and take-profit levels.
Choose your trailing mode: Exact S/L+ (simple) or Advanced (Delay + BE + Ratchet).
Adjust parameters such as ATR length or activation delay to match your strategy.
The script helps you balance risk and reward by ensuring that once the trade moves in your favor, you cannot lose the initial risk, while still benefiting from extended market moves.

BTC Lead(v3.32)Summary
A 15-minute, BTC-focused lead/divergence indicator designed for simple execution: when a ▲/▼ appears, start scaling in with small clips; when a ■ (black square) prints, it means the indicator’s edge has weakened (not that the market trend is over). Real-time expected move label and alert templates included. Do not fade the signal—if you must try the opposite side, wait until a ■ appears.
How to read the signals
▲ Green → Long bias increased
▼ Pink → Short bias increased
■ Black → Edge weakened; consider taking profits/standing aside
Multiple level markers on the same bar (L2/L3/L4) = stronger setup
Live label (top of chart)
A single line shows the Expected Move (%) with arrow and color-coded background (↑ green / ↓ pink) for instant direction clarity.
Tip: Use Replay to watch label → ▲/▼ → ■ sequences on past data.
Confidence filter (important)
|Expected Move| < 1% → treat as noise / ignore
If considering the opposite direction, wait for a ■ first (edge reduced).
Scope
Internal calculations are fixed to 15-minute resolution.
Built for BTC 15m. It may display on other crypto symbols/timeframes, but performance is not guaranteed.
Alerts
Ready-made conditions: ENTRY LONG / ENTRY SHORT / EXIT LONG / EXIT SHORT. Add an alert on this indicator and choose the condition you want.
Risk note
For research/education only. Past behavior doesn’t guarantee future results. Predefine position sizing, stops, and profit-taking, and execute consistently.

BTC Lead(v3.31)Summary
A 15-minute, BTC-focused lead/divergence indicator designed for simple execution: when a ▲/▼ appears, start scaling in with small clips; when a ■ (black square) prints, it means the indicator’s edge has weakened (not that the market trend is over). Real-time expected move label and alert templates included. Do not fade the signal—if you must try the opposite side, wait until a ■ appears.
How to read the signals
▲ Green → Long bias increased
▼ Pink → Short bias increased
■ Black → Edge weakened; consider taking profits/standing aside
Multiple level markers on the same bar (L2/L3/L4) = stronger setup
Live label (top of chart)
A single line shows the Expected Move (%) with arrow and color-coded background (↑ green / ↓ pink) for instant direction clarity.
Tip: Use Replay to watch label → ▲/▼ → ■ sequences on past data.
Confidence filter (important)
|Expected Move| < 1% → treat as noise / ignore
If considering the opposite direction, wait for a ■ first (edge reduced).
Scope
Internal calculations are fixed to 15-minute resolution.
Built for BTC 15m. It may display on other crypto symbols/timeframes, but performance is not guaranteed.
Alerts
Ready-made conditions: ENTRY LONG / ENTRY SHORT / EXIT LONG / EXIT SHORT. Add an alert on this indicator and choose the condition you want.
Risk note
For research/education only. Past behavior doesn’t guarantee future results. Predefine position sizing, stops, and profit-taking, and execute consistently.
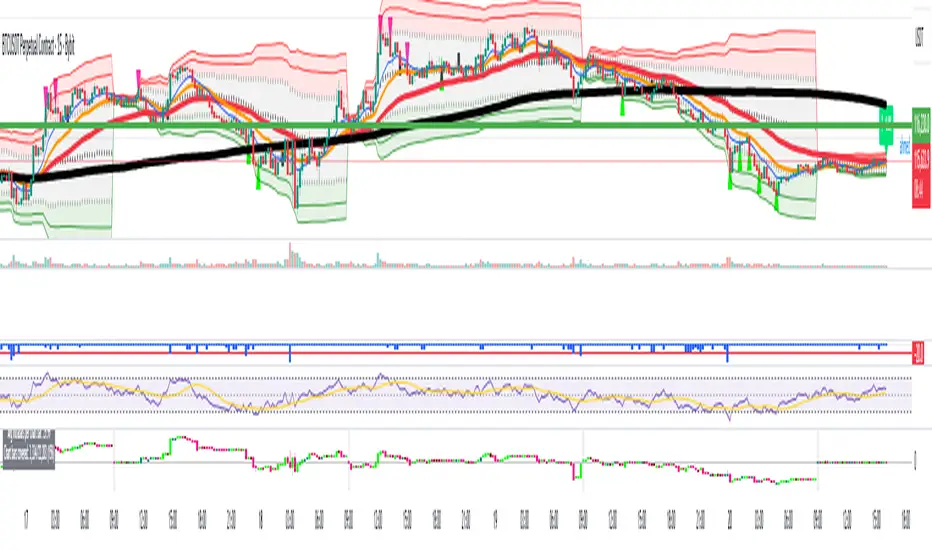
Apex Edge – Wolfe Wave HunterApex Edge – Wolfe Wave Hunter
The modern Wolfe Wave, rebuilt for the algo era
This isn’t just another Wolfe Wave indicator. Classic Wolfe detection is rigid, outdated, and rarely tradable. Apex Edge – Wolfe Wave Hunter re-engineers the pattern into a modern, SMC-driven model that adapts to today’s liquidity-dominated markets. It’s not about drawing pretty shapes – it’s about extracting precision entries with asymmetric risk-to-reward potential.
🔎 What it does
Automatic Wolfe Wave Detection
Identifies bullish and bearish Wolfe Wave structures using pivot-based logic, symmetry filters, and slope tolerances.
Channel Glow Zones
Highlights the Wolfe channel and projects it forward into the future (bars are user-defined). This allows you to see the full potential of the trade before price even begins its move.
Stop Loss (SL) & Entry Arrow
At the completion of Wave 5, the algo prints a Stop Loss line and a tiny entry arrow (green for bullish, red for bearish). but the colours can be changed in user settings. This is the “execution point” — where the Wolfe setup becomes tradable.
Target Projection Lines
TP1 (EPA): Derived from the traditional 1–4 line projection.
TP2 (1.272 Fib): Optional secondary profit target.
TP3 (1.618 Fib): Optional extended target for large runners.
All TP lines extend into the future, so you can track them as price evolves.
Volume Confirmation (optional)
A relative volume filter ensures Wave 5 is formed with meaningful market participation before a setup is confirmed.
Alerts (ready out of the box)
Custom alerts can be fired whenever a bullish or bearish Wolfe Wave is confirmed. No need to babysit the charts — let the script notify you.
⚙️ Customisation & User Control
Every trader’s market and style is different. That’s why Wolfe Wave Hunter is fully customisable:
Arrow Colours & Size
Works on both light and dark charts. Choose your own bullish/bearish entry arrow colours for maximum visibility.
Tolerance Levels
Adjust symmetry and slope tolerance to refine how strict the channel rules are.
Tighter settings = fewer but cleaner zones.
Looser settings = more frequent setups, but with slightly lower structural quality.
Channel Glow Projection
Define how many bars forward the channel is drawn. This controls how far into the future your Wolfe zones are extended.
Stop Loss Line Length
Keep the SL visible without it extending infinitely across your chart.
Take Profit Line Colors
Each TP projection can be styled to your preference, allowing you to clearly separate TP1, TP2, and TP3.
This isn’t a one-size-fits-all tool. You can shape Wolfe detection logic to match the pairs, timeframes, and market conditions you trade most.
🚀 Why it’s different
Classic Wolfe waves are rare — this script adapts the model into something practical and tradeable in modern markets.
Liquidity-aligned — many setups align with structural sweeps of Wave 3 liquidity before driving into profit.
Entry built-in — most Wolfe scripts only draw the structure. Wolfe Wave Hunter gives you a precise entry point, SL, and projected TPs.
Backtest-friendly — you’ll quickly discover which assets respect Wolfe waves and which don’t, creating your own high-probability Wolfe watchlist.
⚠️ Limitations & Disclaimer
Not all markets respect Wolfe Waves. Some FX pairs, metals, and indices respect the structure beautifully; others do not. Backtest and create your own shortlist.
No guaranteed sweeps. Many entries occur after a liquidity sweep of Wave 3, but not all. The algo is designed to detect Wolfe completion, not enforce textbook liquidity rules.
Probabilistic, not predictive. Wolfe setups don’t win every time. Always use risk management.
High-RR focus. This is not a high-frequency tool. It’s designed for precision, asymmetric setups where risk is small and reward potential is large.
✅ The Bottom Line
Apex Edge – Wolfe Wave Hunter is a modern reimagination of the Wolfe Wave. It blends structural geometry, liquidity dynamics, and algo-driven execution into a single tool that:
Detects the pattern automatically
Provides SL, entry, and TP levels
Offers alerts for hands-off trading
Allows deep customisation for different markets
When it hits, it delivers outstanding risk-to-reward. Backtest, refine your tolerances, and build your watchlist of assets where Wolfe structures consistently pay.
This isn’t just Wolfe detection — it’s Wolfe trading, rebuilt for the modern trader.
Developer Notes - As always with the Apex Edge Brand, user feedback and recommendations will always be respected. Simply drop us a message with your comments and we will endeavour to address your needs in future version updates.

Estrategia Cava - IndicadorSimplified Criteria of the Cava Strategy
Below is the logic behind the Cava strategy, broken down into conditions for a buy operation:
Variables and Necessary Data
EMA 55: 55-period Exponential Moving Average.
MACD: Two lines (MACD Line and Signal Line) and the histogram.
RSI: Relative Strength Index.
Stochastic: Two lines (%K and %D).
Closing Price: The closing price of the current period.
Previous Closing Price: The closing price of the previous period.
Entry Logic (Buy Operation)
Trend Condition (EMA 55):
The price must be above the EMA 55.
The EMA 55 must have a positive slope (or at least not a negative one). This can be checked if the current EMA 55 is greater than the previous period's EMA 55.
Momentum Conditions (Oscillators):
MACD: The MACD line must have crossed above the signal line. For a strong signal, this cross should occur near or above the zero line.
RSI: The RSI must have exited the "oversold" zone (generally below 30) and be rising.
Stochastic: The Stochastic must have crossed upwards from the "oversold" zone (generally below 20).
Confirmation Condition (Price):
The current closing price must be higher than the previous closing price. This confirms the strength of the signal.
Position Management (Exit)
Take Profit: An exit can be programmed at a predetermined price target (e.g., the next resistance level) or when the momentum of the move begins to decrease.
Stop Loss: A stop loss should be placed below a significant support level or the entry point to limit losses in case the trade does not evolve as expected. The Cava strategy focuses on dynamic stop-loss management, moving it in the trader's favor as the price moves.
In summary, the strategy is a filtering system. If all conditions are met, the trade is considered high probability. If only some are met, the signal is discarded, and you wait for the next one. It's crucial to understand that discipline and risk management are just as important as the indicators themselves.

Gann Trading Strategy📈 Simple & Powerful Gann-Based Trading System
This indicator automatically calculates key Gann support and resistance levels based on W.D. Gann's mathematical principles. Simply input either the highest price (for bearish setups) or lowest price (for bullish setups), and the indicator automatically generates all trading levels.
🎯 Key Features:
Automatic Level Calculation - Just select High/Low price projection basis
Complete Trading Framework - Entry zone, 3 Take Profit levels, and Exit level
Visual Trading Zones - Color-coded zones around each level for better entry/exit timing
Smart Alerts - Get notified when price reaches key levels
Bullish & Bearish Setups - Works for both long and short trading strategies
Customizable Display - Show/hide levels, adjust colors, line styles, and zone widths
🚀 How to Use:
Select "Lowest Price" for bullish setup or "Highest Price" for bearish setup
Input the relevant high or low price from your analysis
The indicator automatically calculates and displays all trading levels
Use the green entry zone for entries, blue levels for take profits, red level for exits
📊 Perfect for:
Swing trading
Position sizing and risk management
Support/resistance analysis
Multi-timeframe analysis
Uses time-tested Gann principles to automatically find key price levels for trading.

Wickless Heikin Ashi B/S [CHE]Wickless Heikin Ashi B/S \
Purpose.
Wickless Heikin Ashi B/S \ is built to surface only the cleanest momentum turns: it prints a Buy (B) when a bullish Heikin-Ashi candle forms with virtually no lower wick, and a Sell (S) when a bearish Heikin-Ashi candle forms with no upper wick. Optional Lock mode turns these into one-shot signals that hold the regime (bull or bear) until the opposite side appears. The tool can also project dashed horizontal lines from each signal’s price level to help you manage entries, stops, and partial take-profits visually.
How it works.
The indicator computes standard Heikin-Ashi values from your chart’s OHLC. A bar qualifies as bullish if its HA close is at or above its HA open; bearish if below. Then the wick on the relevant side is compared to the bar’s HA range. If that wick is smaller than your selected percentage threshold (plus a tiny tick epsilon to avoid rounding noise), the raw condition is considered “wickless.” Only one side can fire; on the rare occasion both raw conditions would overlap, the bar is ignored to prevent false dual triggers. When Lock is enabled, the first valid signal sets the active regime (background shaded light green for bull, light red for bear) and suppresses further same-side triggers until the opposite side appears, which helps reduce overtrading in chop.
Why wickless?
A missing wick on the “wrong” side of a Heikin-Ashi candle is a strong hint of persistent directional pressure. In practice, this filters out hesitation bars and many mid-bar flips. Traders who prefer entering only when momentum is decisive will find wickless bars useful for timing entries within an established bias.
Visuals you get.
When a valid buy appears, a small triangle “B” is plotted below the bar and a green dashed line can extend to the right from the signal’s HA open price. For sells, a triangle “S” above the bar and a red dashed line do the same. These lines act like immediate, price-anchored references for stop placement and profit scaling; you can shift the anchor left by a chosen number of bars if you prefer the line to start a little earlier for visual alignment.
How to trade it
Establish context first.
Pick a timeframe that matches your style: intraday index or crypto traders often use 5–60 minutes; swing traders might prefer 2–4 hours or daily. The tool is agnostic, but the cleanest results occur when the market is already trending or attempting a fresh breakout.
Entry.
When a B prints, the simplest rule is to enter long at or just after bar close. A conservative variation is to require price to take out the high of the signal bar in the next bar(s). For S, invert the logic: enter short on or after close, or only if price breaks the signal bar’s low.
Stop-loss.
Place the stop beyond the opposite extreme of the signal HA bar (for B: under the HA low; for S: above the HA high). If you prefer a static reference, use the dashed line level (signal HA open) or an ATR buffer (e.g., 1.0–1.5× ATR(14)). The goal is to give the trade enough room that normal noise does not immediately knock you out, while staying small enough to keep the risk contained.
Take-profit and management.
Two pragmatic approaches work well:
R-multiple scaling. Define your initial risk (distance from entry to stop). Scale out at 1R, 2R, and let a runner go toward 3R+ if structure holds.
Trailing logic. Trail behind a short moving average (e.g., EMA 20) or progressive swing points. Many traders also exit on the opposite signal when Lock flips, especially on faster timeframes.
Position sizing.
Keep risk per trade modest and consistent (e.g., 0.25–1% of account). The indicator improves timing; it does not replace risk control.
Settings guidance
Max lower wick for Bull (%) / Max upper wick for Bear (%).
These control how strict “wickless” must be. Tighter values (0.3–1.0%) yield fewer but cleaner signals and are great for strong trends or low-noise instruments. Looser values (1.5–3.0%) catch more setups in volatile markets but admit more noise. If you notice too many borderline bars triggering during high-volatility sessions, increase these thresholds slightly.
Lock (one-shot until opposite).
Keep Lock ON when you want one decisive signal per leg, reducing noise and signal clusters. Turn it OFF only if your plan intentionally scales into trends with multiple entries.
Extended lines & anchor offset.
Leave lines ON to maintain a visual memory of the last trigger levels. These often behave like near-term support/resistance. The offset simply lets you start that line one or more bars earlier if you prefer the look; it does not change the math.
Colors.
Use distinct bull/bear line colors you can read easily on your theme. The default lime/red scheme is chosen for clarity.
Practical examples
Momentum continuation (long).
Price is above your baseline (e.g., EMA 200). A B prints with a tight lower wick filter. Enter on close; stop under the signal HA low. Price pushes up in the next bars; you scale at 1R, trail the rest with EMA 20, and finally exit when a distant S appears or your trail is hit.
Breakout confirmation (short).
Following a range, price breaks down and prints an S with no upper wick. Enter short as the bar closes or on a subsequent break of the signal bar’s low. If the next bar immediately rejects and prints a bullish HA bar, your stop above the signal HA high limits damage. Otherwise, ride the move, harvesting partials as the red dashed line remains unviolated.
Alerts and automation
Set alerts to “Once Per Bar Close” for stability.
Bull ONE-SHOT fires when a valid buy prints (and Lock allows it).
Bear ONE-SHOT fires for sells analogously.
With Lock enabled, you avoid multiple pings in the same direction during a single leg—useful for webhooks or mobile notifications.
Reliability and limitations
The script calculates from completed bars and does not use higher-timeframe look-ahead or repainting tricks. Heikin-Ashi smoothing can lag turns slightly, which is expected and part of the design. In narrow ranges or whipsaw conditions, signals naturally thin out; if you must trade ranges, either tighten the wick filters and keep Lock ON, or add a trend/volatility filter (e.g., trade B only above EMA 200; S only below). Remember: this is an indicator, not a strategy. If you want exact statistics, port the triggers into a strategy and backtest with your chosen entry, stop, and exit rules.
Final notes
Wickless Heikin Ashi B/S \ is a precision timing tool: it waits for decisive, wickless HA bars, provides optional regime locking to reduce noise, and leaves clear price anchors on your chart for disciplined management. Use it with a simple framework—trend bias, fixed risk, and a straightforward exit plan—and it will keep your execution consistent without cluttering the screen or your decision-making.
Disclaimer: This indicator is for educational use and trade assistance only. It is not financial advice. You alone are responsible for your risk and results.
Enhance your trading precision and confidence with Wickless Heikin Ashi B/S ! 🚀
Happy trading
Chervolino

RSI MA Cross + Divergence Signal (V2) Core Logic
RSI + Moving Average
The script calculates a standard RSI (default 14).
It then overlays a moving average (SMA/EMA/WMA, default 9).
When RSI crosses above its MA → bullish momentum.
When RSI crosses below its MA → bearish momentum.
Divergence Filter
Signals are only valid if there’s confirmed divergence:
Bullish divergence: Price makes a lower low, RSI makes a higher low.
Bearish divergence: Price makes a higher high, RSI makes a lower high.
Overbought / Oversold Filter
Optional extra:
Bullish signals only valid if RSI ≤ 30 (oversold).
Bearish signals only valid if RSI ≥ 70 (overbought).
This ensures signals happen in “stretched” conditions.
Risk & Trade Management
Entries taken only when all conditions align.
Exits can be managed with ATR stops, partial take-profits, breakeven moves, and trailing stops (we coded these in the strategy version).
Cooldown, session filters, and daily loss guard to keep risk tight.
🔹 Strengths
✅ High selectivity: Combining RSI cross + divergence + OB/OS means signals are rare but higher quality.
✅ Great at catching reversals: Divergence highlights where price may be running out of steam.
✅ Risk management baked in: ATR stops + partial exits smooth out equity curve.
✅ Works across markets: ES, FX, crypto — anywhere RSI divergences are respected.
✅ Flexible: You can loosen/tighten filters depending on aggressiveness.
🔹 Weaknesses
❌ Lag from pivots: Divergence only confirms after a few bars → you enter late sometimes.
❌ Choppy in ranges: In sideways markets, RSI divergences appear often and whipsaw.
❌ Filters reduce signals: With all filters ON (divergence + OB/OS + trend + session), signals can be very rare — may under-trade.
❌ Not standalone: Needs higher-timeframe context (trend, liquidity pools) to avoid counter-trend entries.
🔹 Best Ways to Trade It
Use Higher Timeframe Bias
Run the strategy on 15m/1H, but only trade in direction of higher timeframe trend (e.g., 4H EMA).
Example: If daily is bullish → only take bullish divergences.
Pair With Structure
Look for signals at key zones: HTF support/resistance, VWAP, or FVGs.
Divergence + RSI cross inside an FVG is a strong entry trigger.
Adjust OB/OS for Volatility
For crypto/FX: use 35/65 instead of 30/70 (markets trend harder).
For ES/S&P: 30/70 works fine.
Risk Management Is King
Use partial exits: take profit at 1R, trail rest.
Size by % of equity (we coded this into the strategy).
Avoid News Spikes
Divergences break down around CPI, NFP, Fed announcements — stay flat.
🔹 When It Shines
Trending markets that make extended pushes → clean divergences.
Reversal zones (oversold → bullish bounce, overbought → bearish fade).
Swing trading (15m–4H) — less noise than 1m/5m scalping.
🔹 When to Avoid
Low volatility chop → lots of false divergences.
During high-impact news → RSI swings wildly.
In strong one-way trends without pullbacks — divergence keeps calling tops/bottoms too early.
✅ Summary:
This is a reversal-focused RSI divergence strategy with strict filters. It’s powerful when combined with higher-timeframe bias + structure confluence, but weak if traded blindly in choppy or news-driven conditions. Best to treat it as a precision entry trigger, not a full system — layer it on top of your FVG/ORB framework for maximum edge.
